Monitoring
Timeplus provides detailed metrics and states to monitor Materialized Views.
The Timeplus Console offers visualizations for these metrics and states, but you can also query them directly.
Timeplus Console
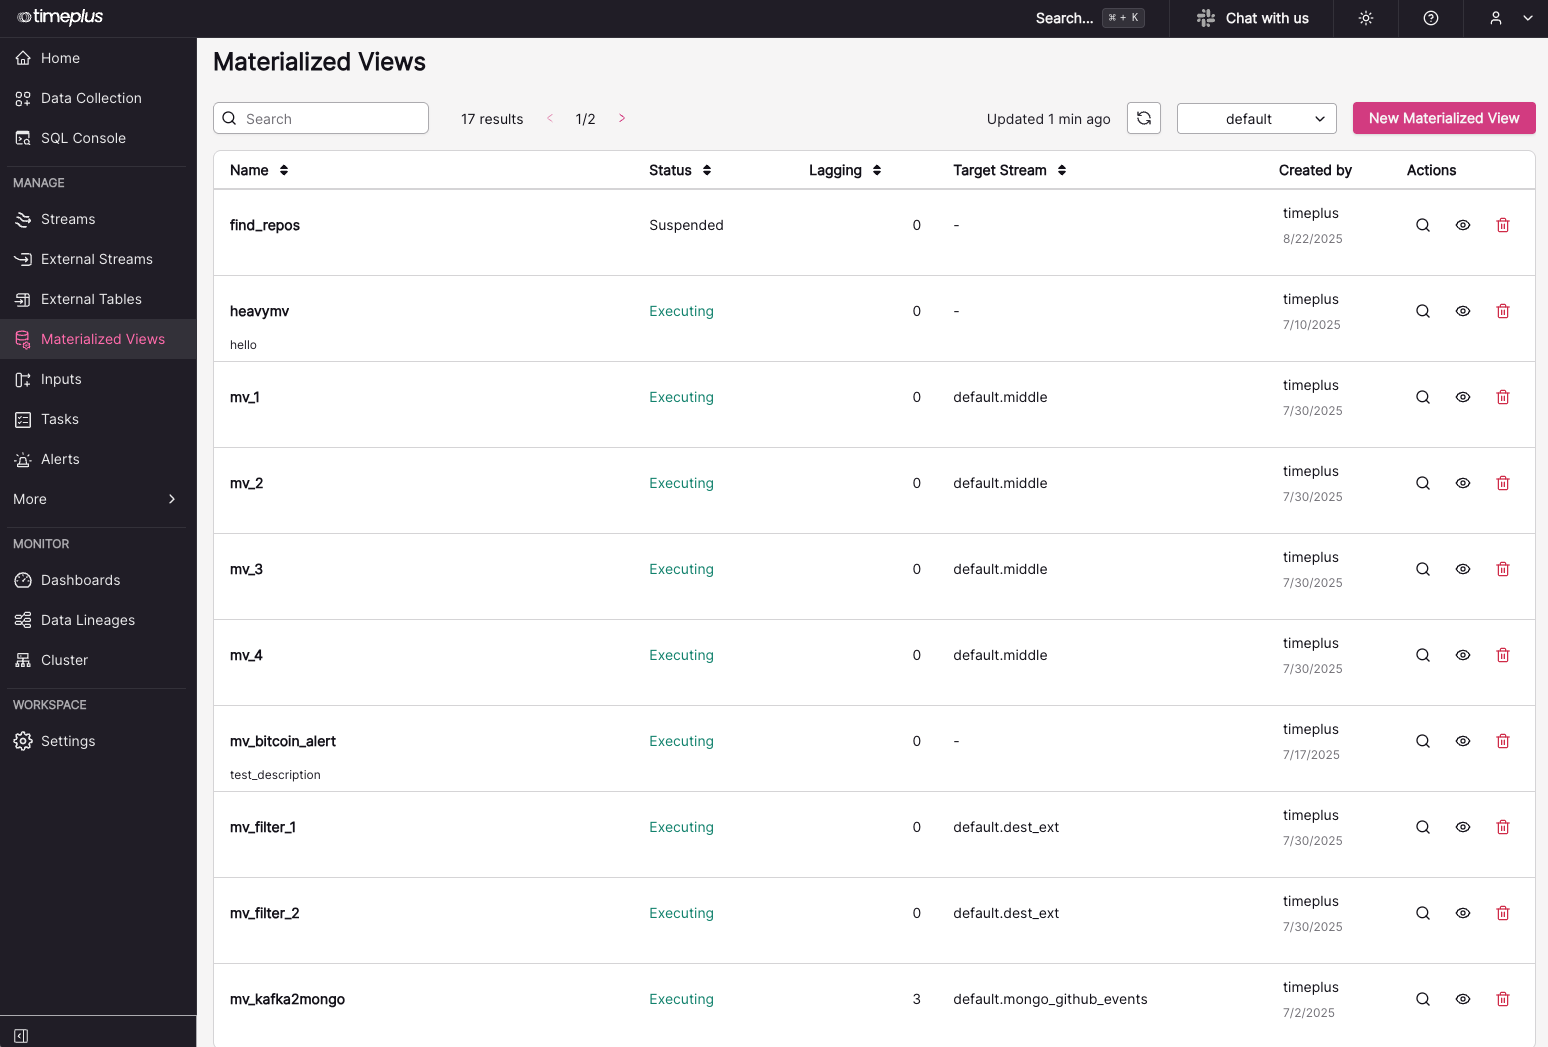
Here are screenshots from Timeplus Materialized View monitoring in the Timeplus Console.
High Level Information
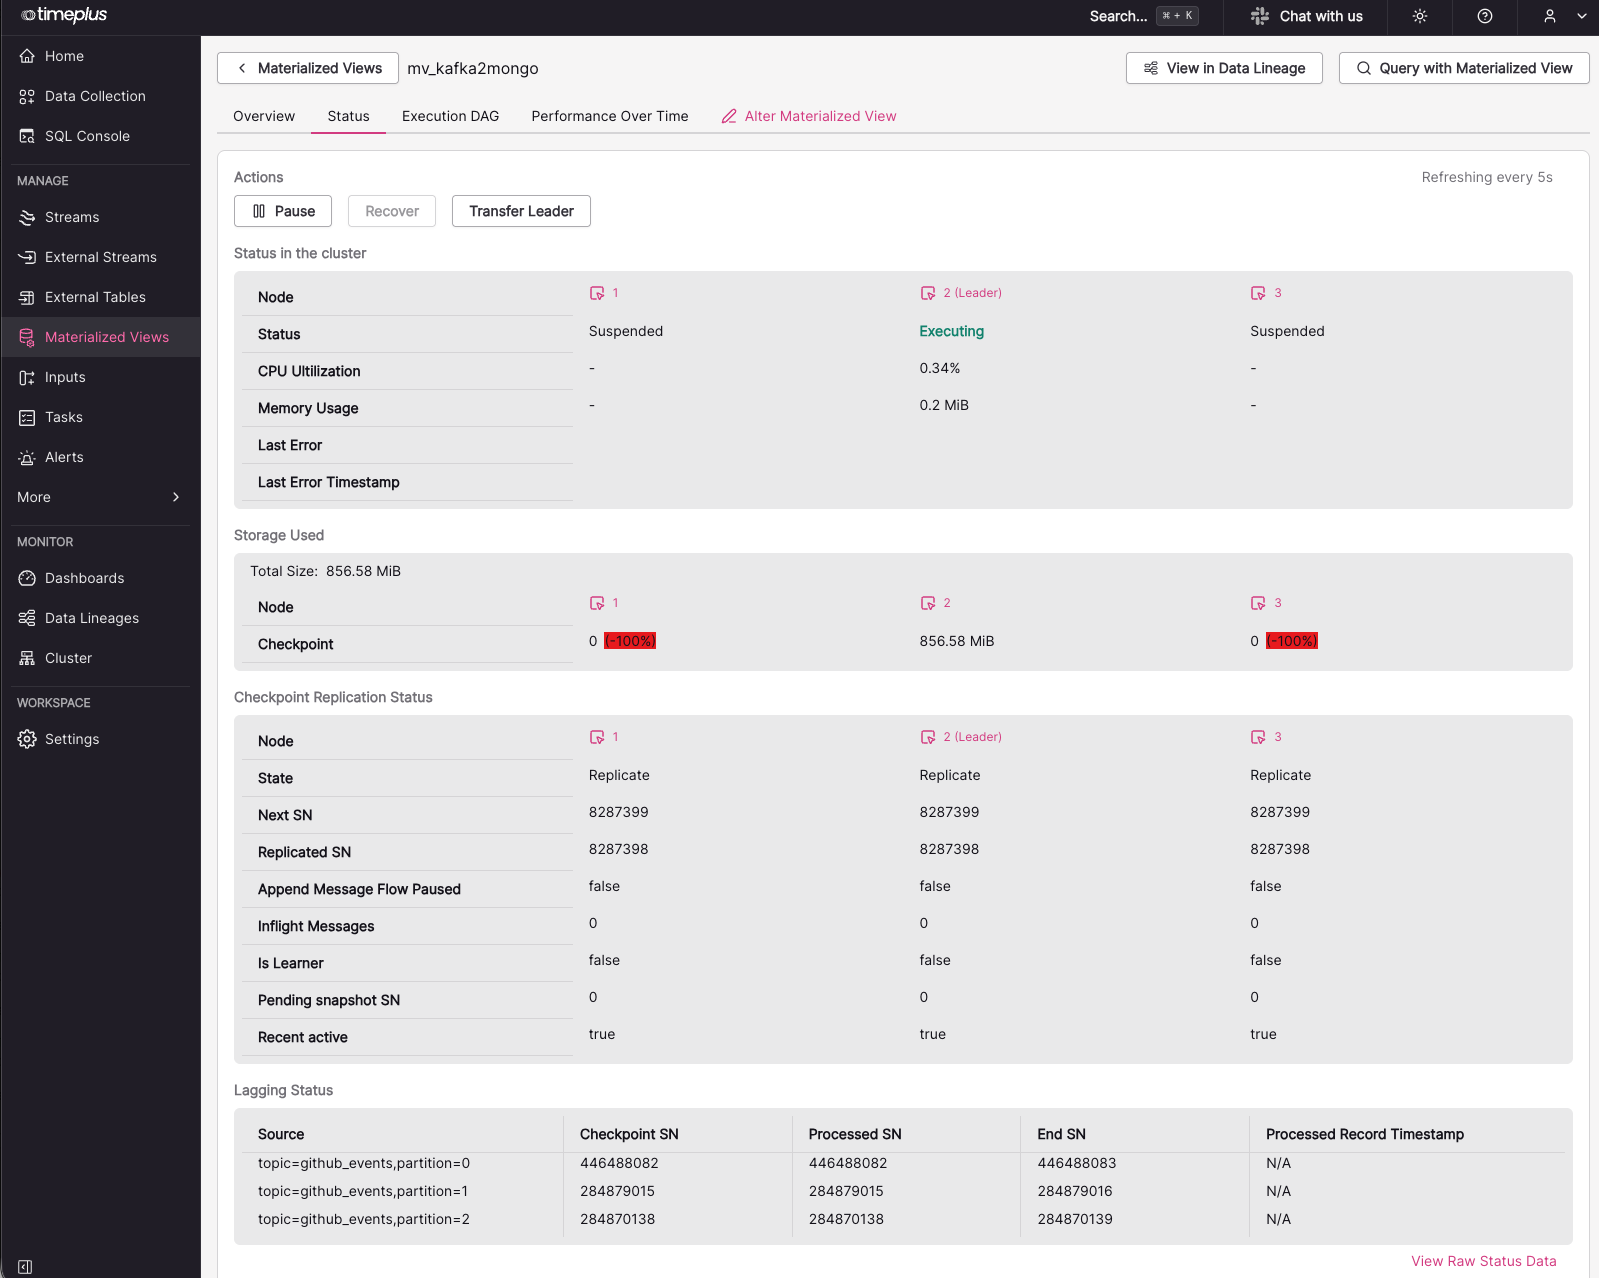
Detail Metrics
Metrics
The system.stream_metric_log stream records performance metrics such as events per second (eps) and megabytes per second (mbps) for Materialized Views, streams, external streams, and external tables.
Example:
SELECT
    node_id,
    database,
    name,
    (read_bytes * 1000) / elapsed_ms AS rbps,
    (read_rows * 1000) / elapsed_ms AS reps,
    (written_bytes * 1000) / elapsed_ms AS wbps,
    (written_rows * 1000) / elapsed_ms AS weps
FROM table(system.stream_metric_log)
WHERE type = 'MaterializedView'
  AND _tp_time > now() - 1h;
States
In Timeplus Enterprise 3.0 and later, the system.introspection_state_log stream contains detailed state information for monitoring and alerting. In earlier releases, use system.stream_state_log instead.
Supported states include:
last_error_message: Last error message of the Materialized View.recover_times: Number of recovery attempts.memory_usage: Current memory usage of the Materialized View.checkpoint_storage_size: Total size of checkpoint data.last_checkpoint_bytes: Checkpoint size (bytes) in the last epoch.last_checkpoint_elapsed_ms: Time taken (ms) for the last checkpoint.start_sn: Current start offset/sequence (Kafka partition or Timeplus shard).end_sn: Current end offset/sequence (Kafka partition or Timeplus shard).processed_sn: Current processed offset/sequence.ckpt_sn: Last checkpointed offset/sequence.processed_record_ts: Timestamp of the last processed record.
Example:
SELECT
    *
FROM
    table(system.introspection_state_log)
WHERE
    starts_with(dimension, 'materialized_view')
    AND state_name IN ('end_sn', 'processed_sn');
System Built-in Views
Timeplus provides built-in system views to help monitor and debug Materialized Views:
system.v_failed_mat_views: Tracks Materialized Views that have failed.system.v_mat_view_lags: Shows Materialized Views with processing lag.system.v_storages: Shows stream and checkpoint storage usage, which is useful when a Materialized View is accumulating checkpoint data.system.v_stream_applied_lags: Shows per-node applied lag for replicated streams when a Materialized View is blocked by upstream replication or storage apply delay.
For the full list of built-in troubleshooting views, see Views in system namespace.
If you are running a 2.x release, replace system.introspection_state_log in the examples above with system.stream_state_log.