Timeplus 企业版
Timeplus Enterprise is a high-performance converged platform that unifies streaming and historical data processing, to empower developers to build the most powerful and reliable streaming analytics applications, at speed and scale, anywhere.
Timeplus Enterprise provides the following major features:
Timeplus Enterprise is available as a fully-managed cloud service with zero ops and elastic scaling, or as a self-hosted deployment, ideal for enterprise users requiring flexible and advanced configurations.
Quickstart for Timeplus Enterprise self-hosting
The following section contains step-by-step instructions on how to easily get started with a self-hosted Timeplus Enterprise.
Step 1: install Timeplus Enterprise via a single command
如果你的服务器或电脑运行的是 Linux 或 macOS,你可以运行以下命令来下载软件包并在没有任何其他依赖关系的情况下启动 Timeplus Enterprise。 For Windows users, please follow our guide for running Timeplus Enterprise with Docker.
curl -sSf https://raw.githubusercontent.com/timeplus-io/proton/develop/install.sh | sh
此脚本会将最新的软件包(基于您的操作系统和 CPU 架构)下载到当前文件夹。 解压缩包并启动 Timeplus 企业服务器。
Step 2: Setup the user account
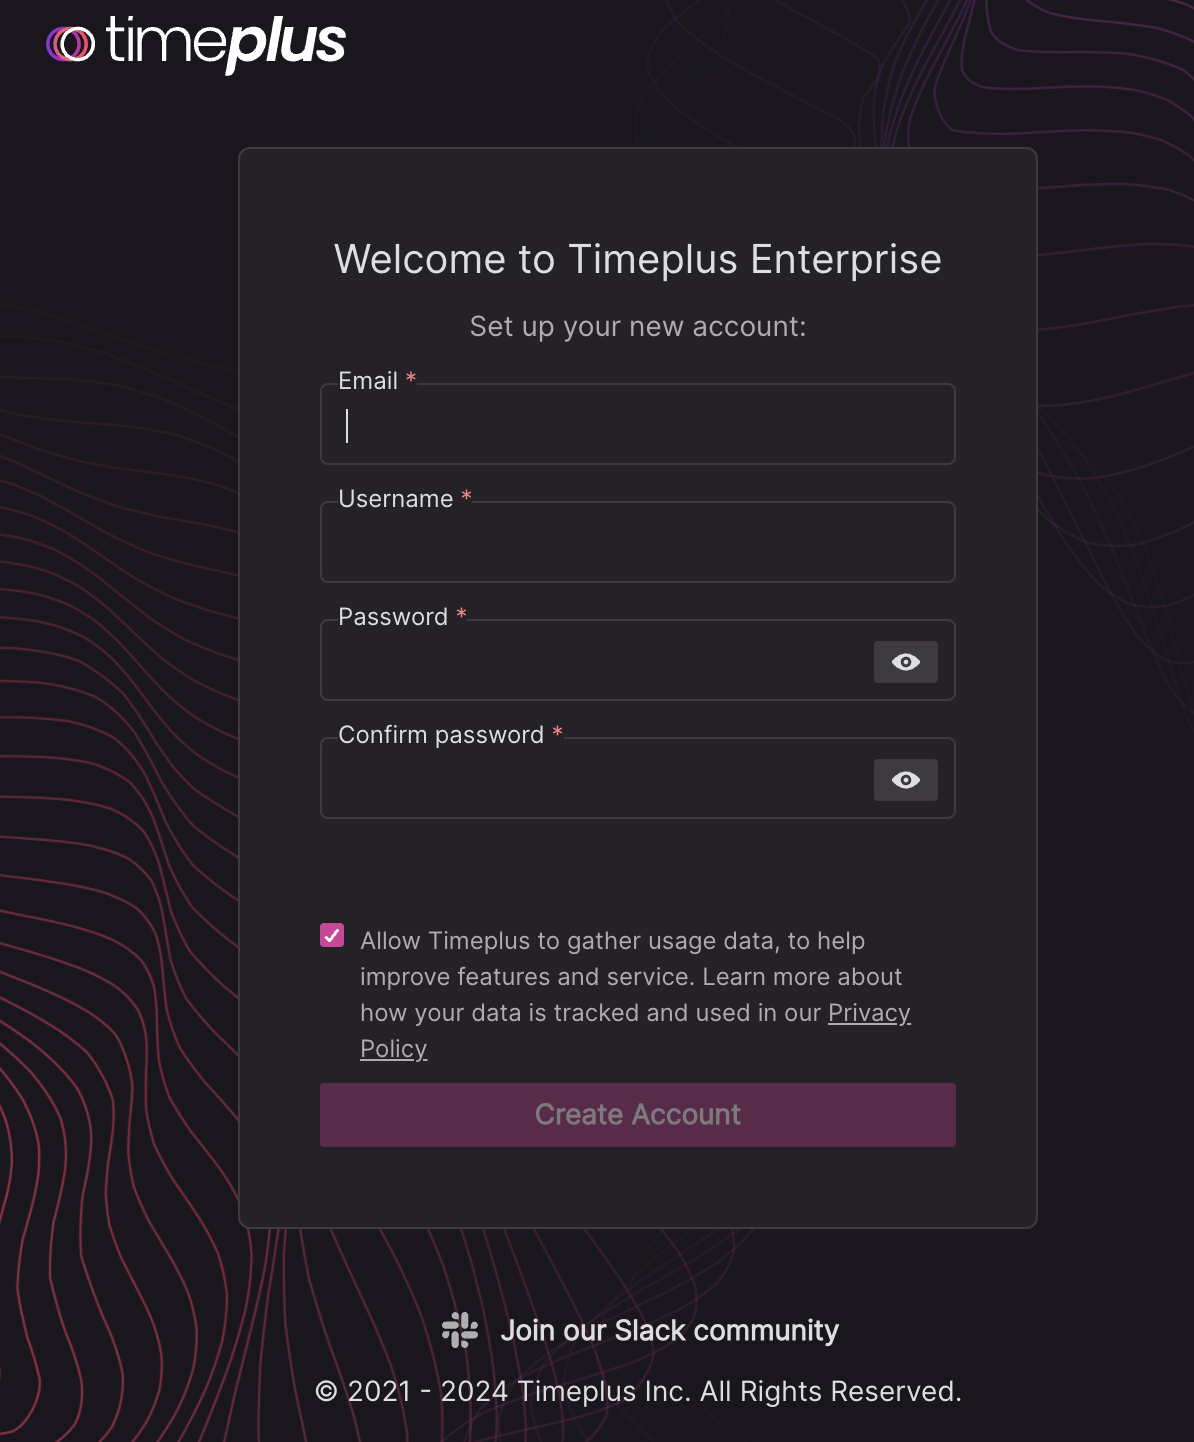
通过 http://localhost:8000 访问 Timeplus Enterprise 网络控制台。 首次登录时,请使用密码创建一个帐户以开始 30 天免费试用。
After creating the account, login with that username and password. 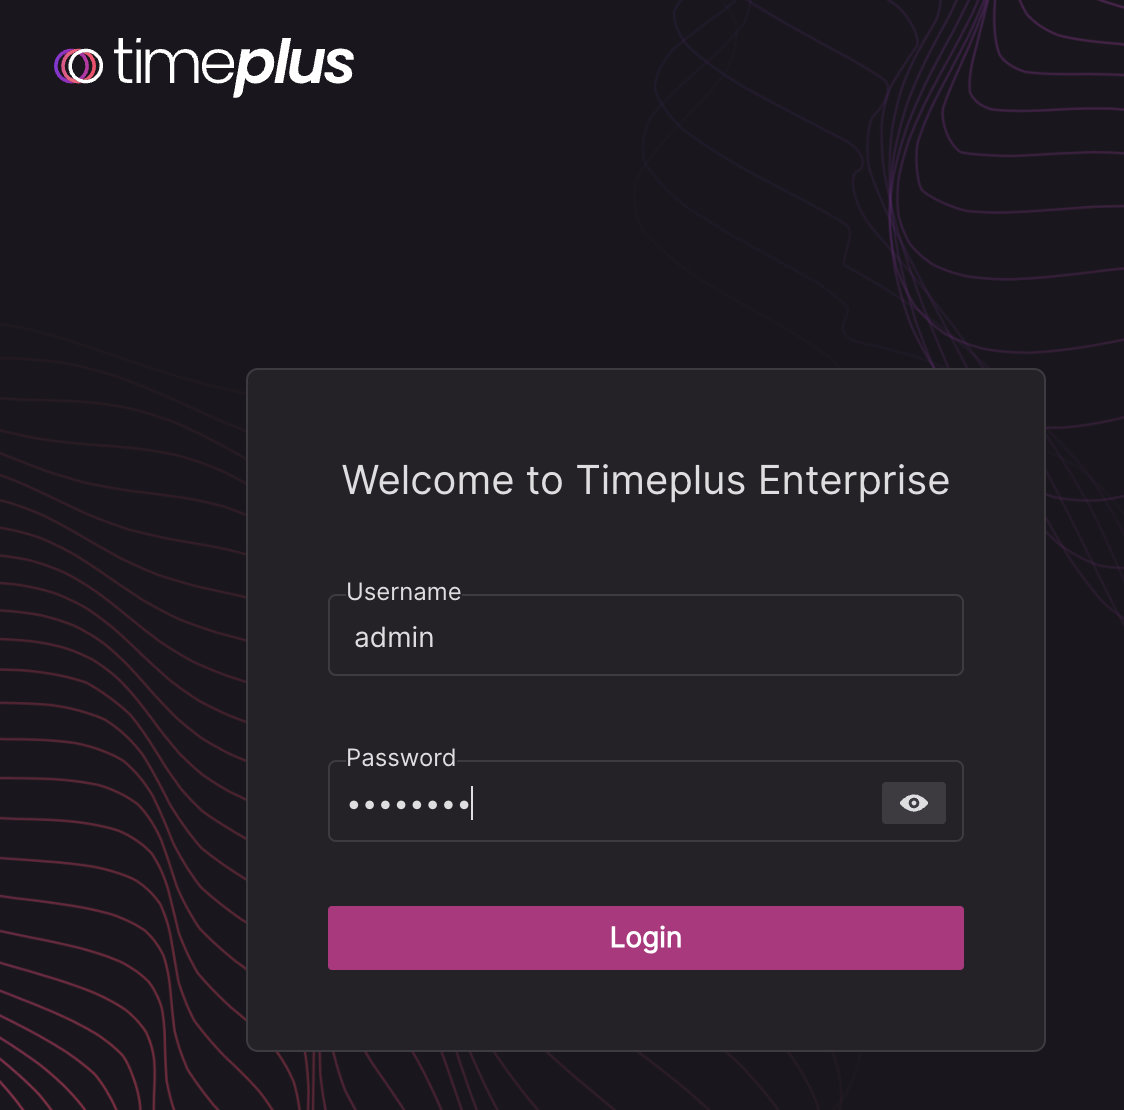
第 3 步:加载您的流数据
如果你的流数据位于或可公开访问的 Kafka 或 Pulsar 实例中,请按照以下任一文档 在 Timeplus Cloud 中创建源,然后返回此处完成快速入门:
如果你还没有流式数据源并且想测试一下Timeplus的工作原理,Timeplus提供内置的 数据源,为一些常见用例生成流式数据。
创建示例源
-
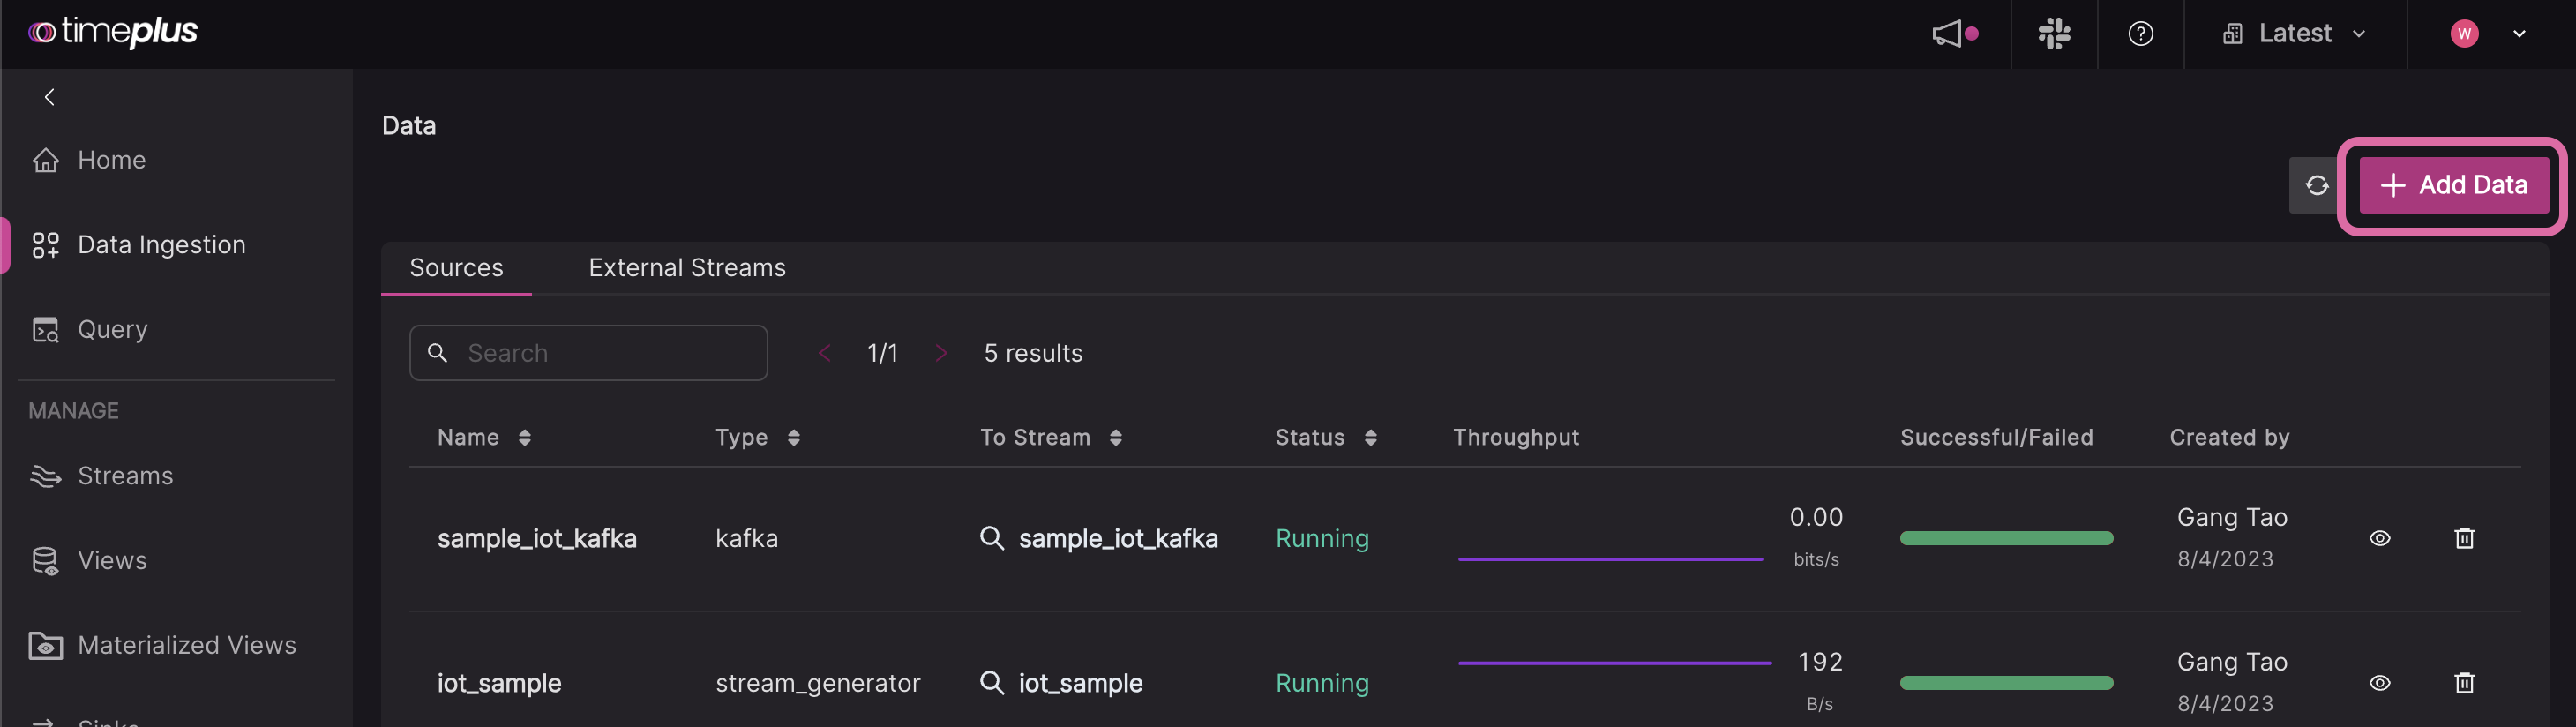
Create the first source in your workspace. 在左侧导航菜单中,单击 数据摄取,然后单击右上角的 添加数据 按钮。
-
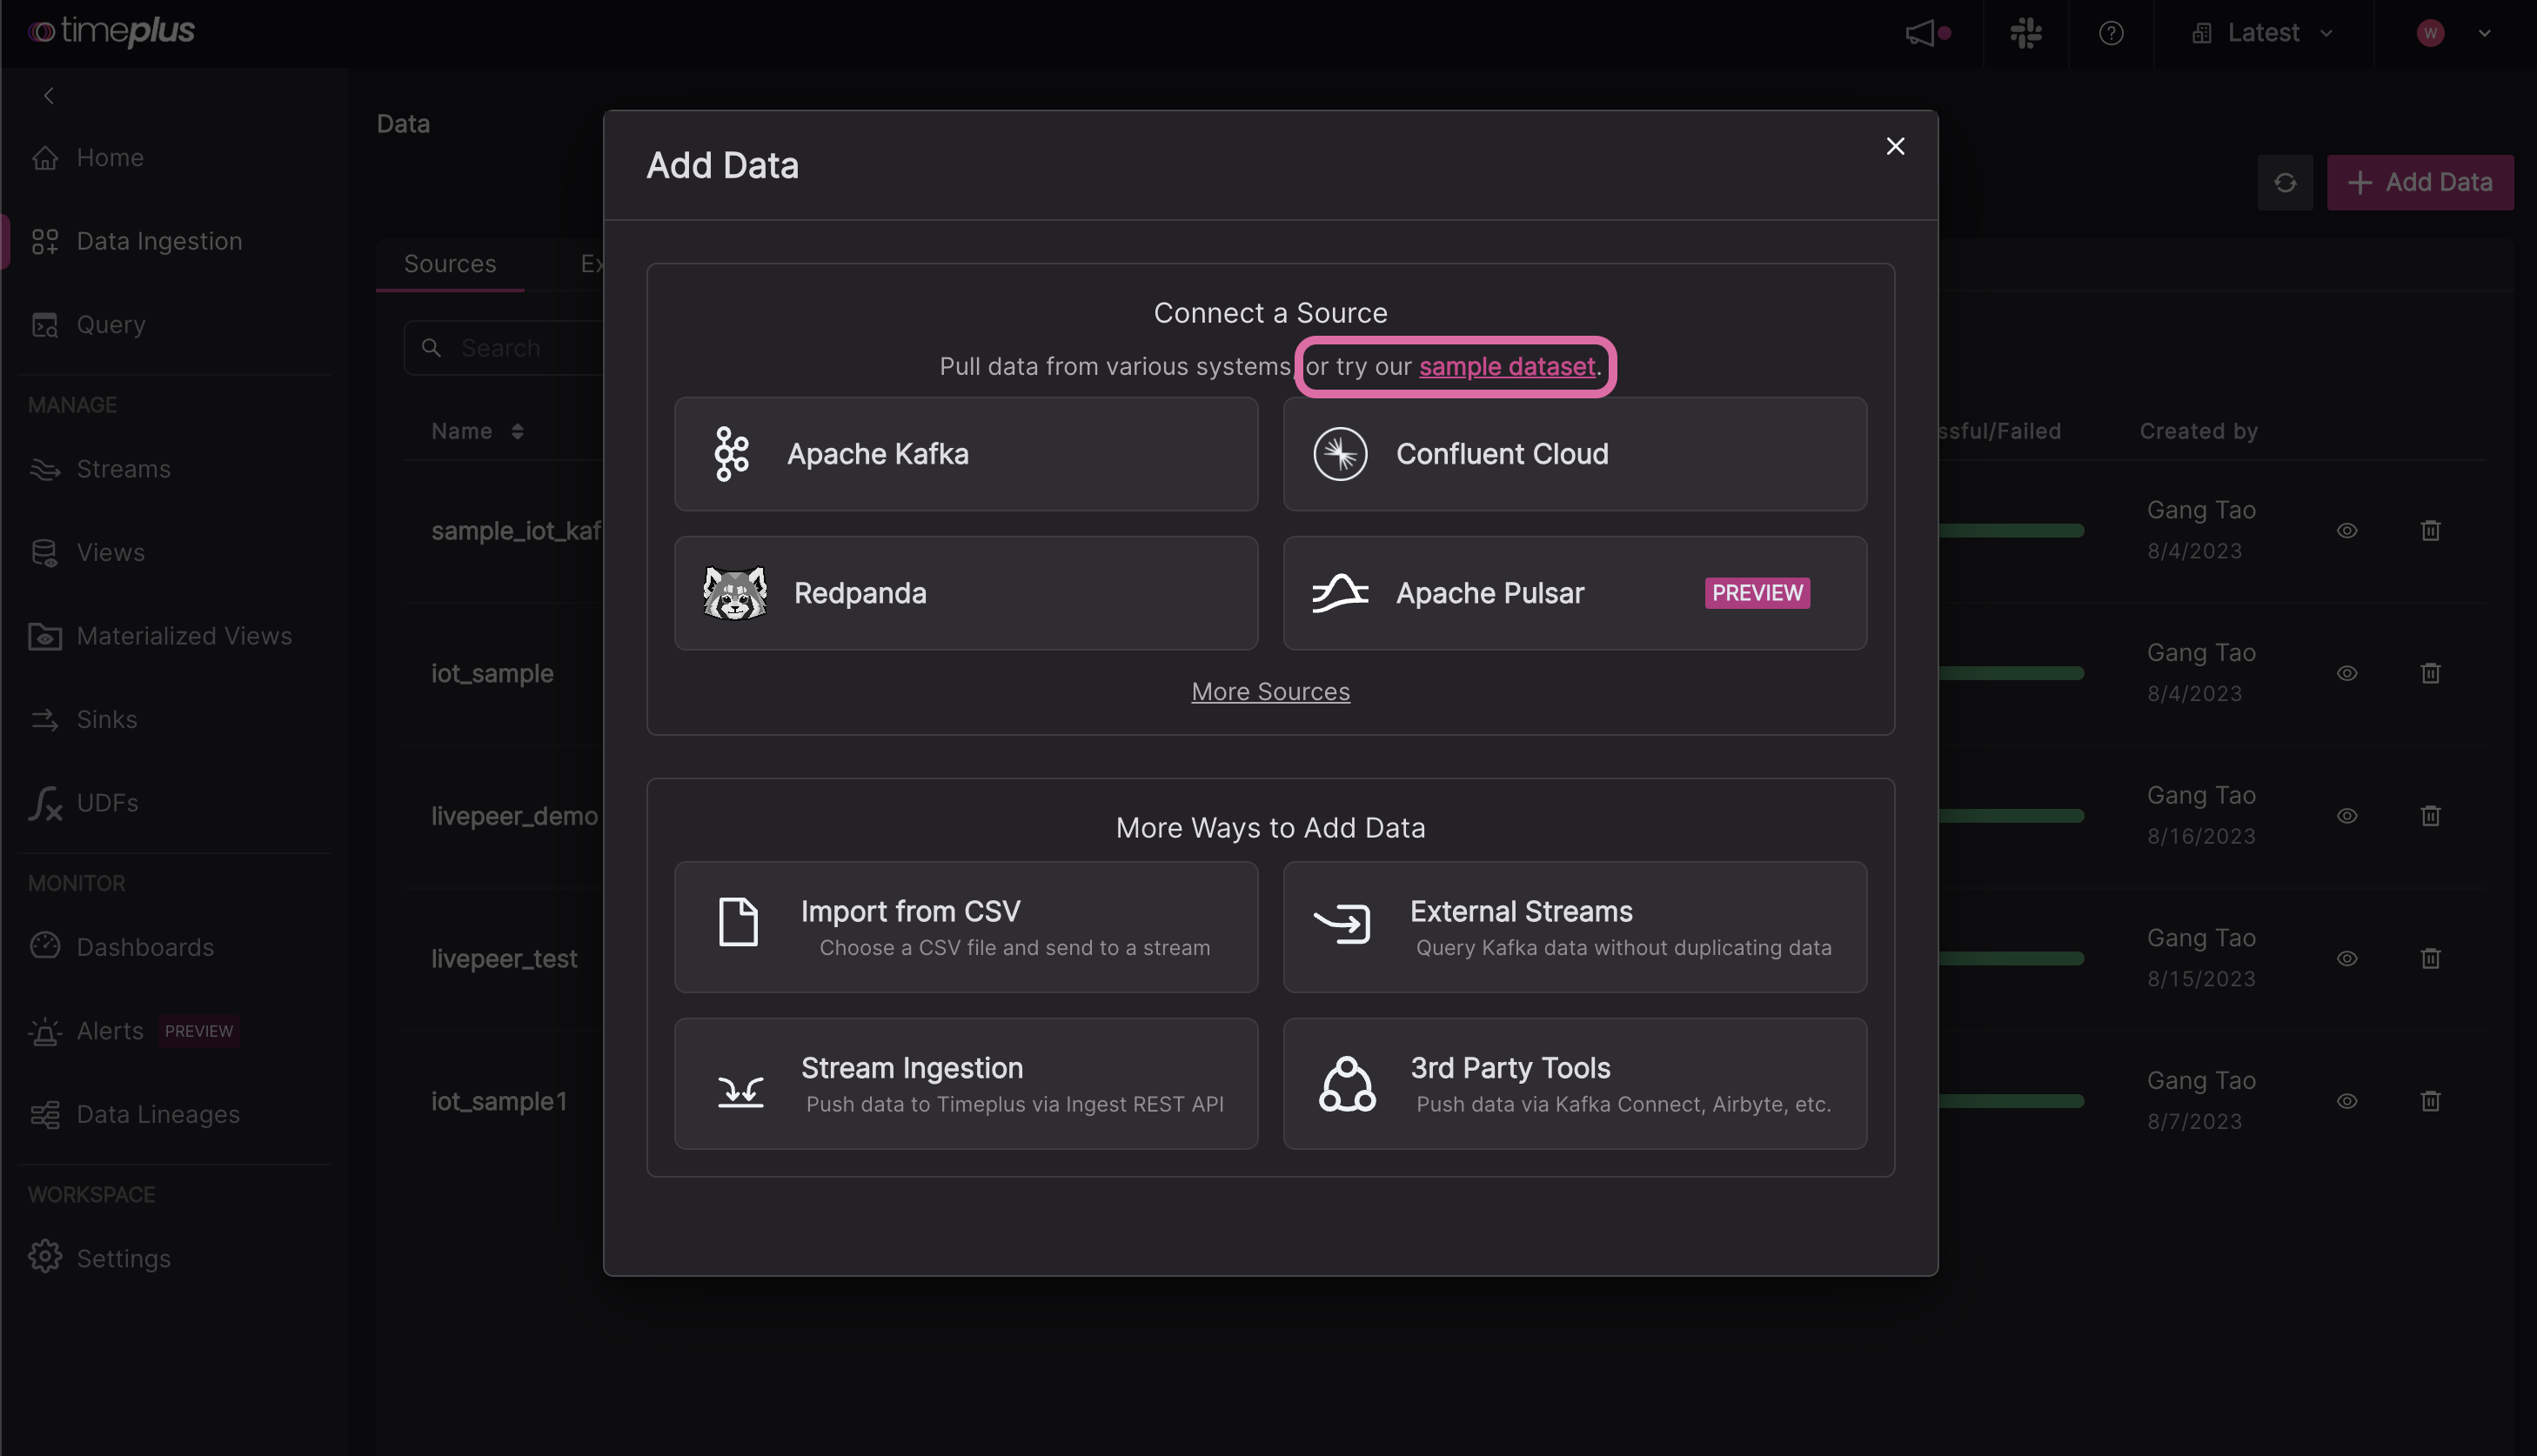
在此弹出窗口中,单击 示例数据集 链接。
-
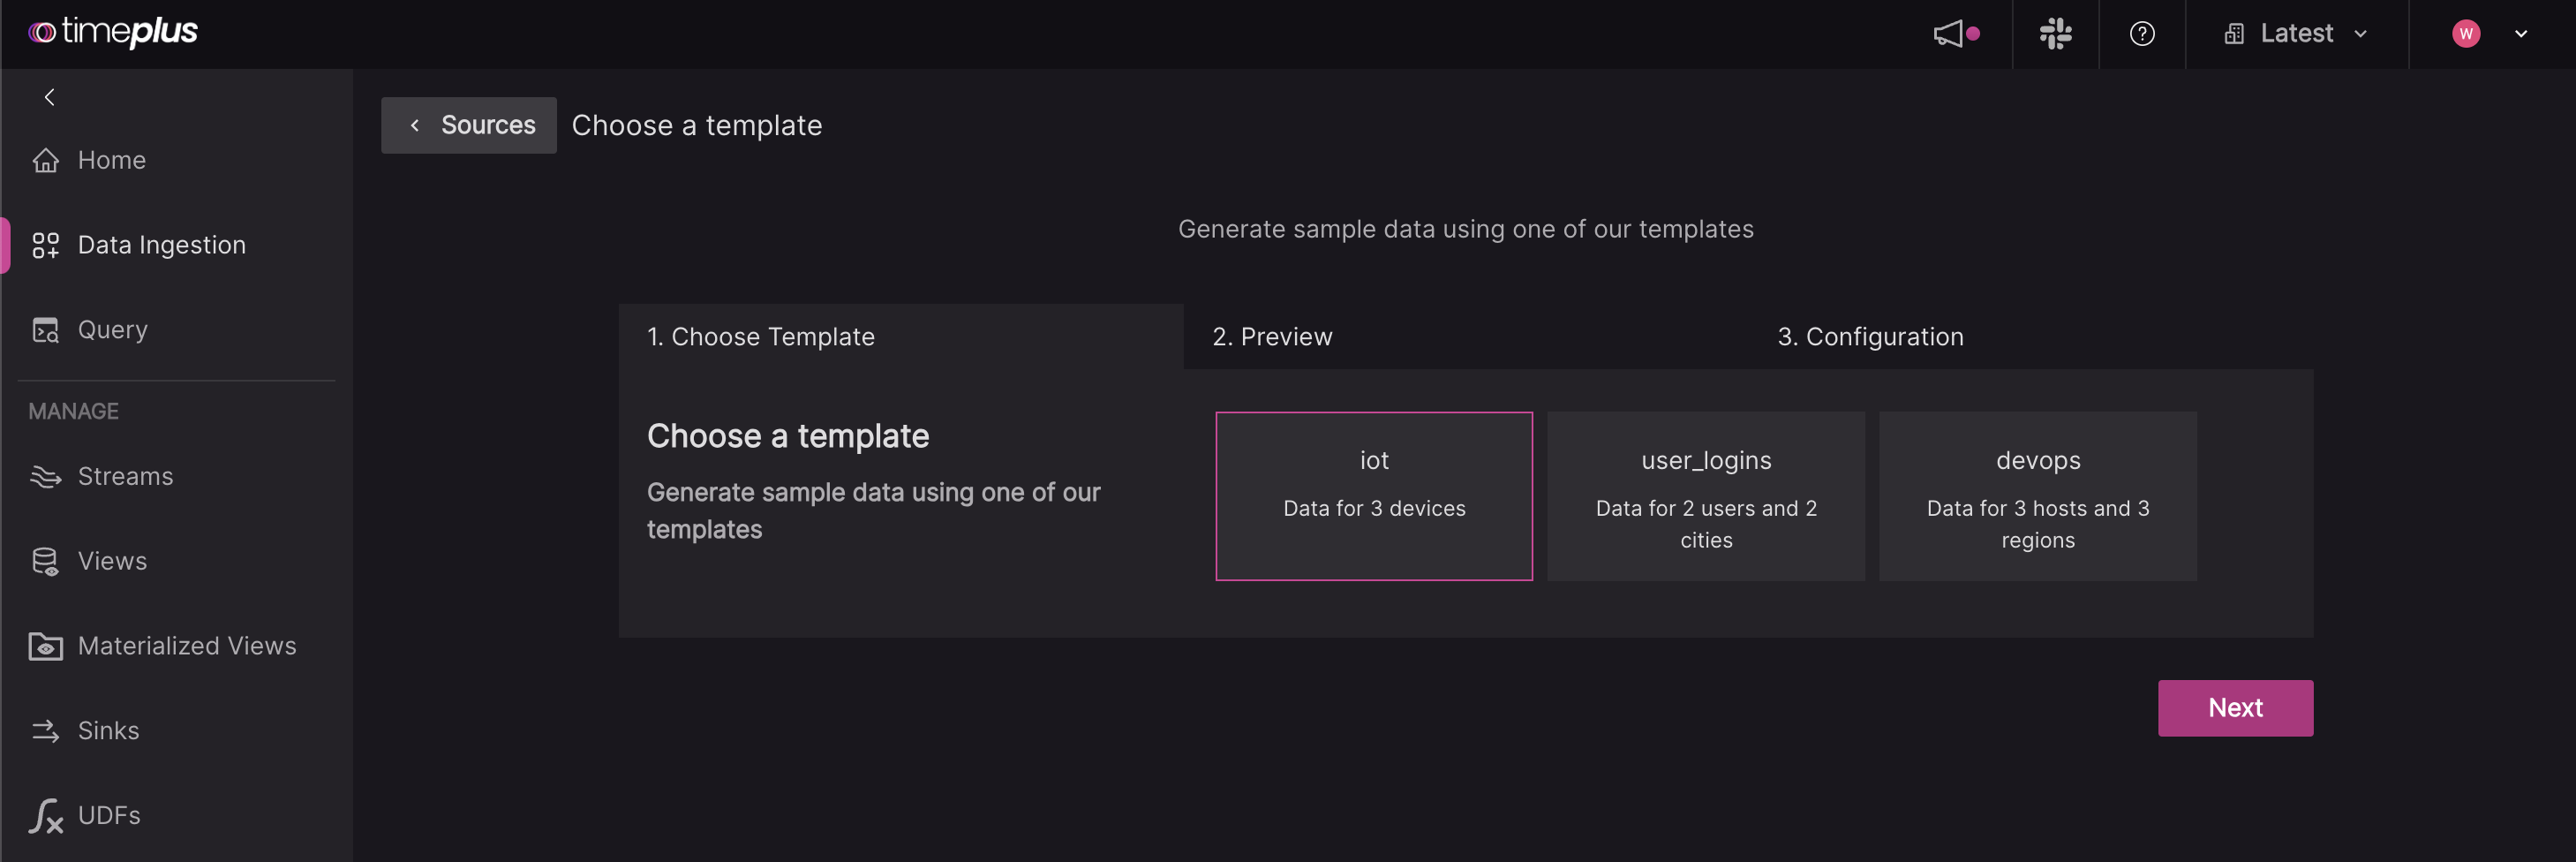
从三个模板中选择一个:
- IoT:三台设备的数据
- 用户 登录:两个用户和两个城市的数据
- DevOps:三台主机和三个区域的数据
-
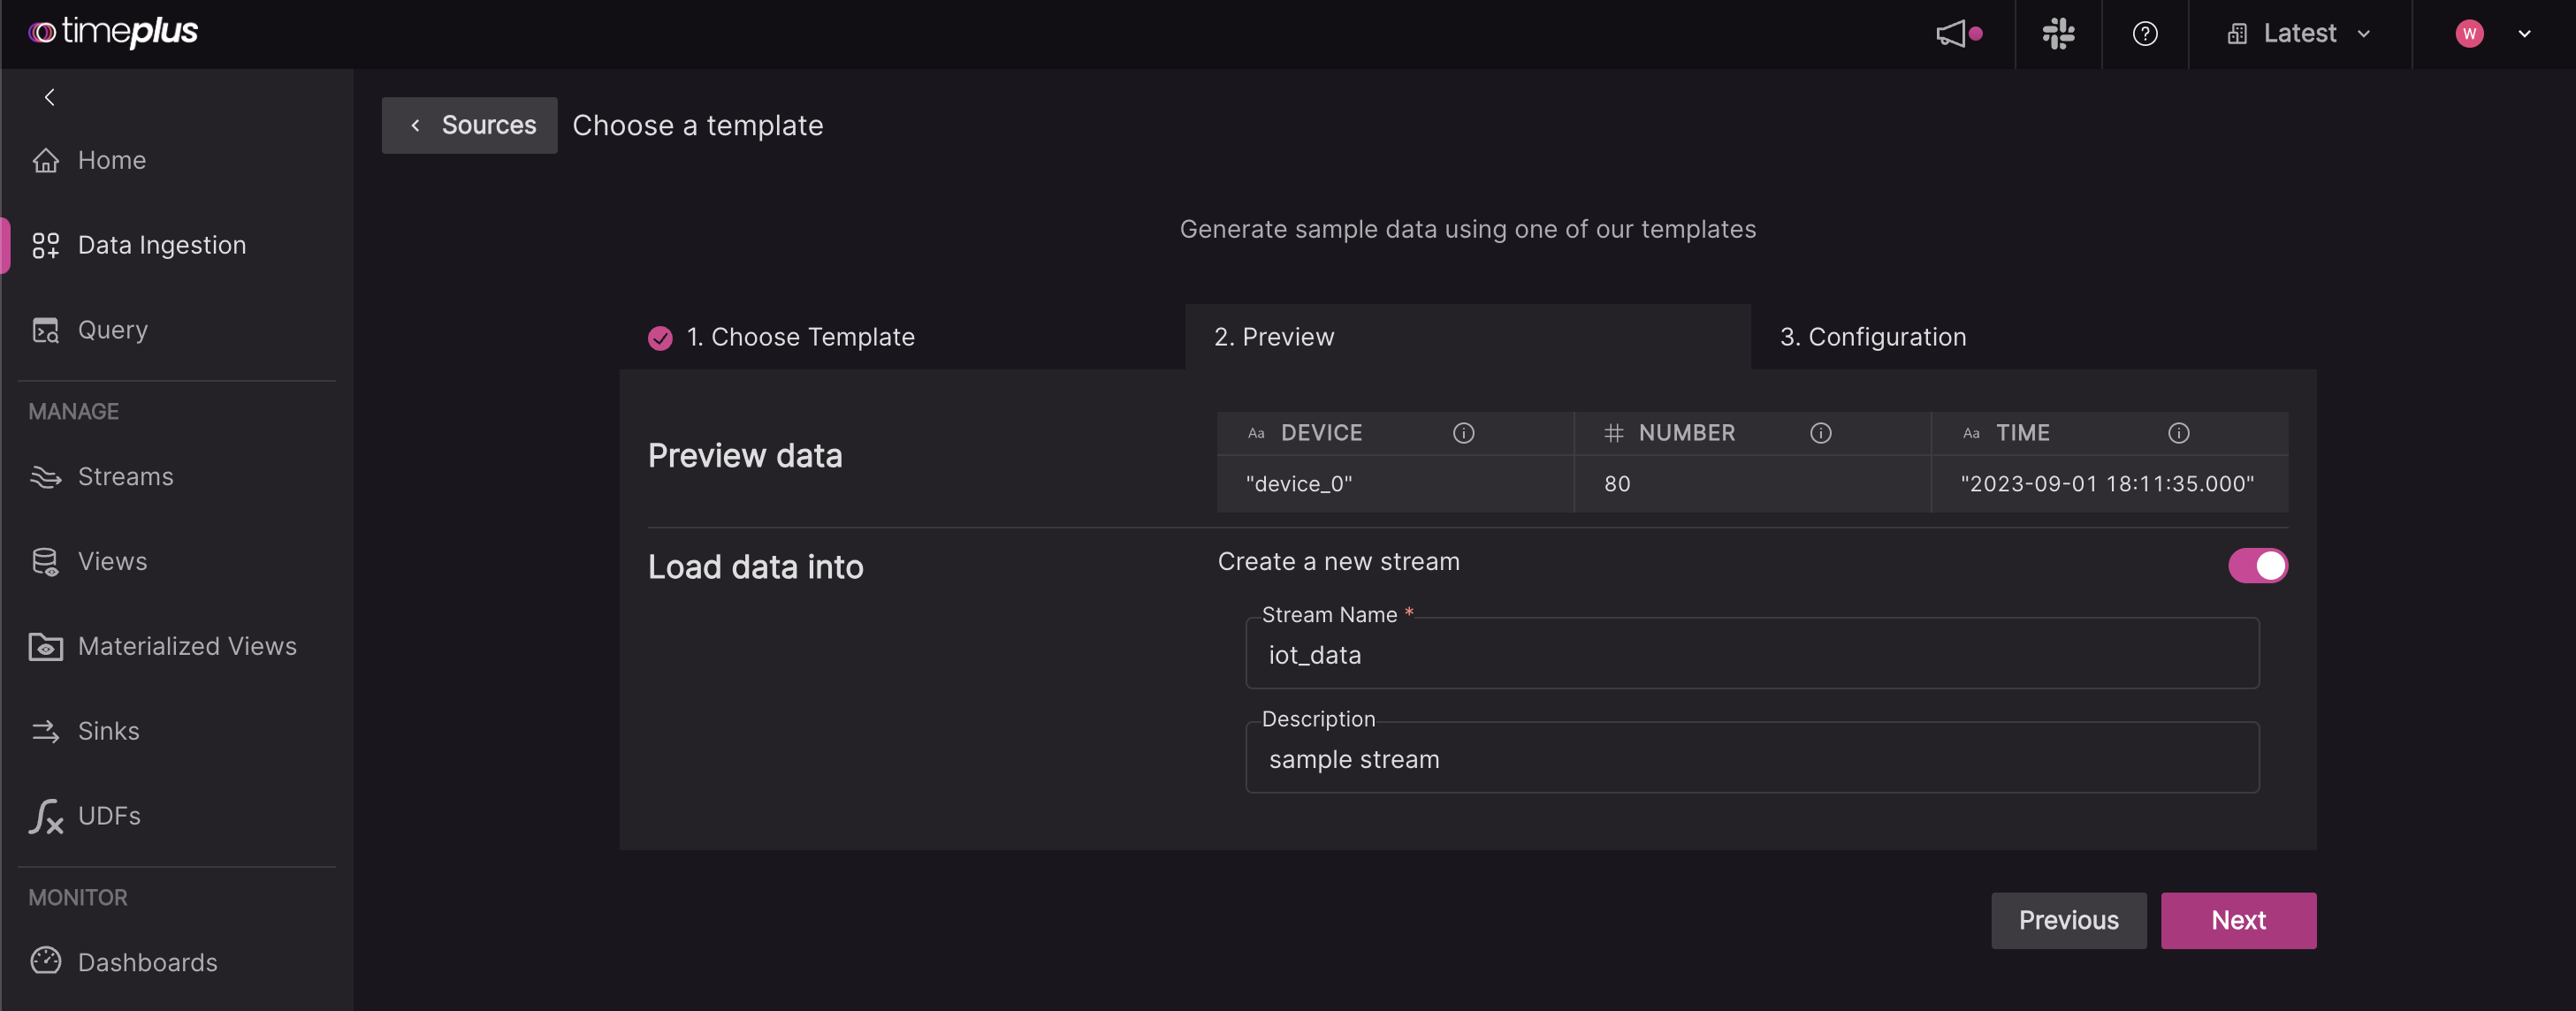
预览您的数据并创建一个新的数据流来加载数据。 对于流名称,它只能包含字母、 数字或下划线,并且必须以字母开头。 你也可以给它一个可选的描述。
-
给同一个源起一个名字,比如
iot,然后查看 JSON 配置。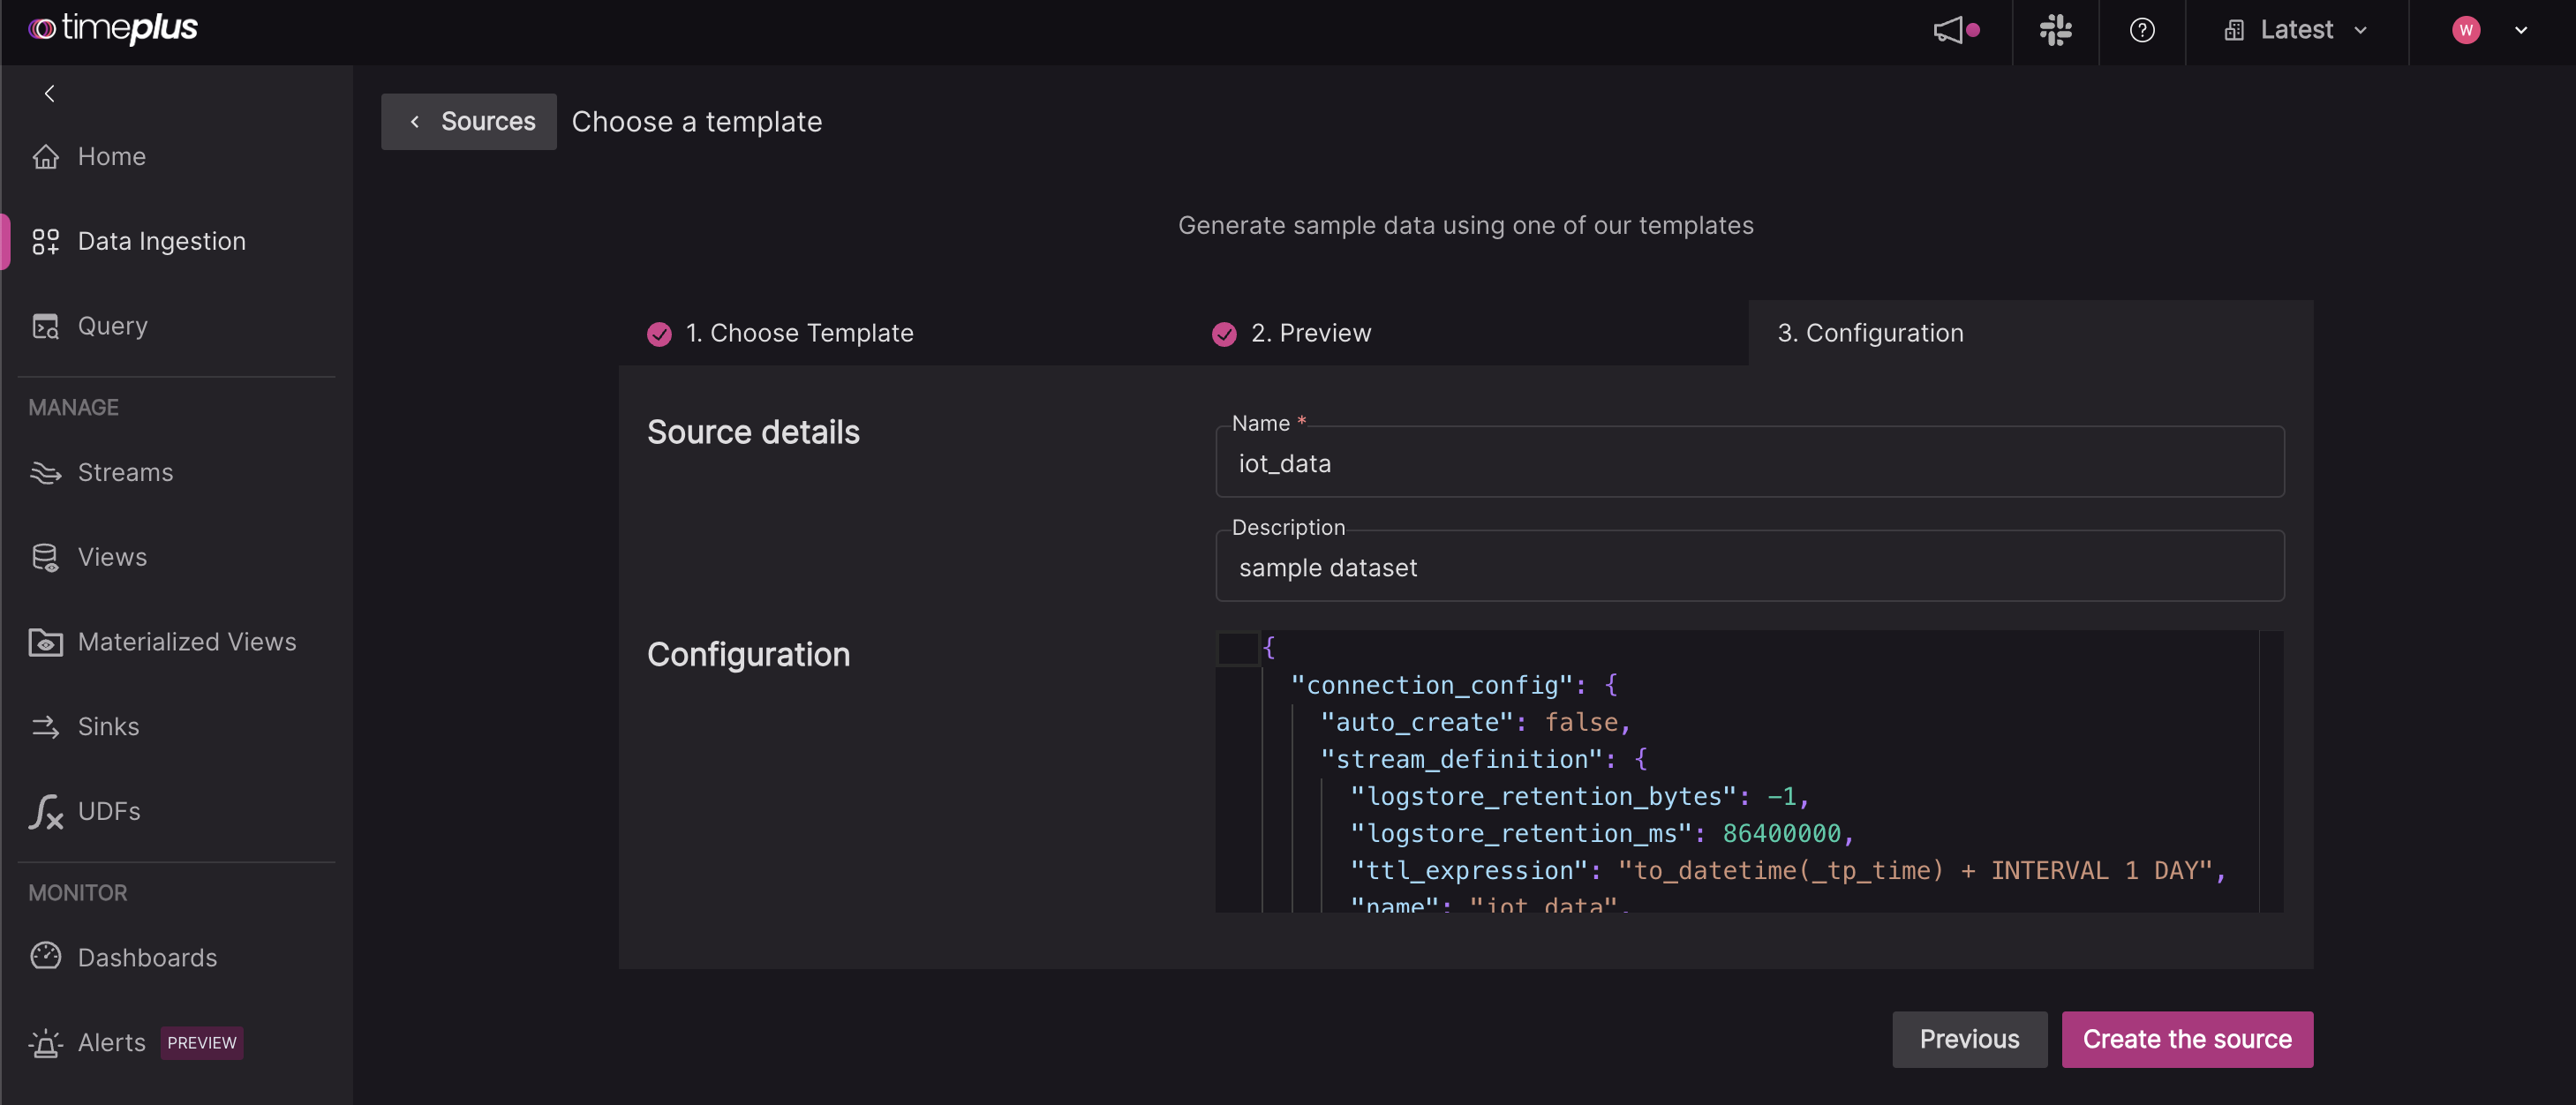
探索流数据
-
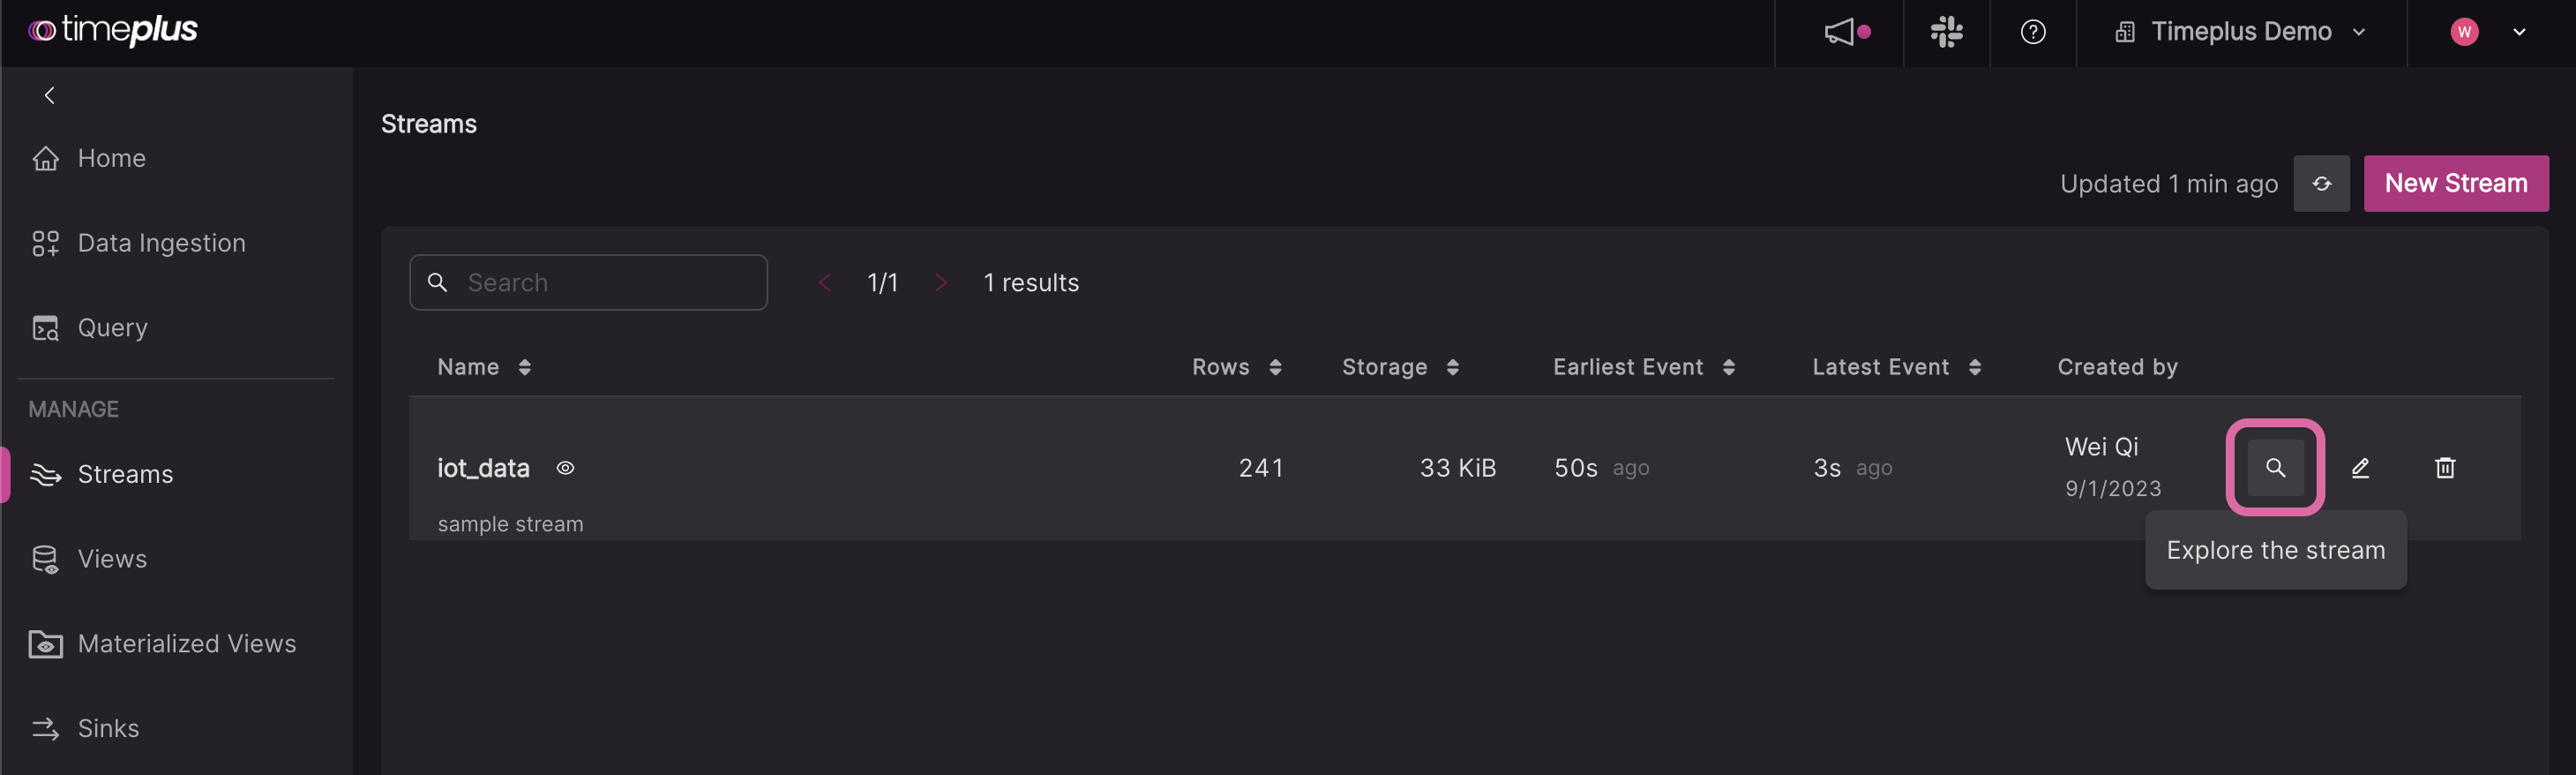
要查看新创建的流中的数据,您可以:
a。 前往 Streams 页面,点击 Explore 图标。
b。 或者,转到 Query 页面,然后在 SQL 编辑器下方的 SQL 帮助器中单击流的名称。
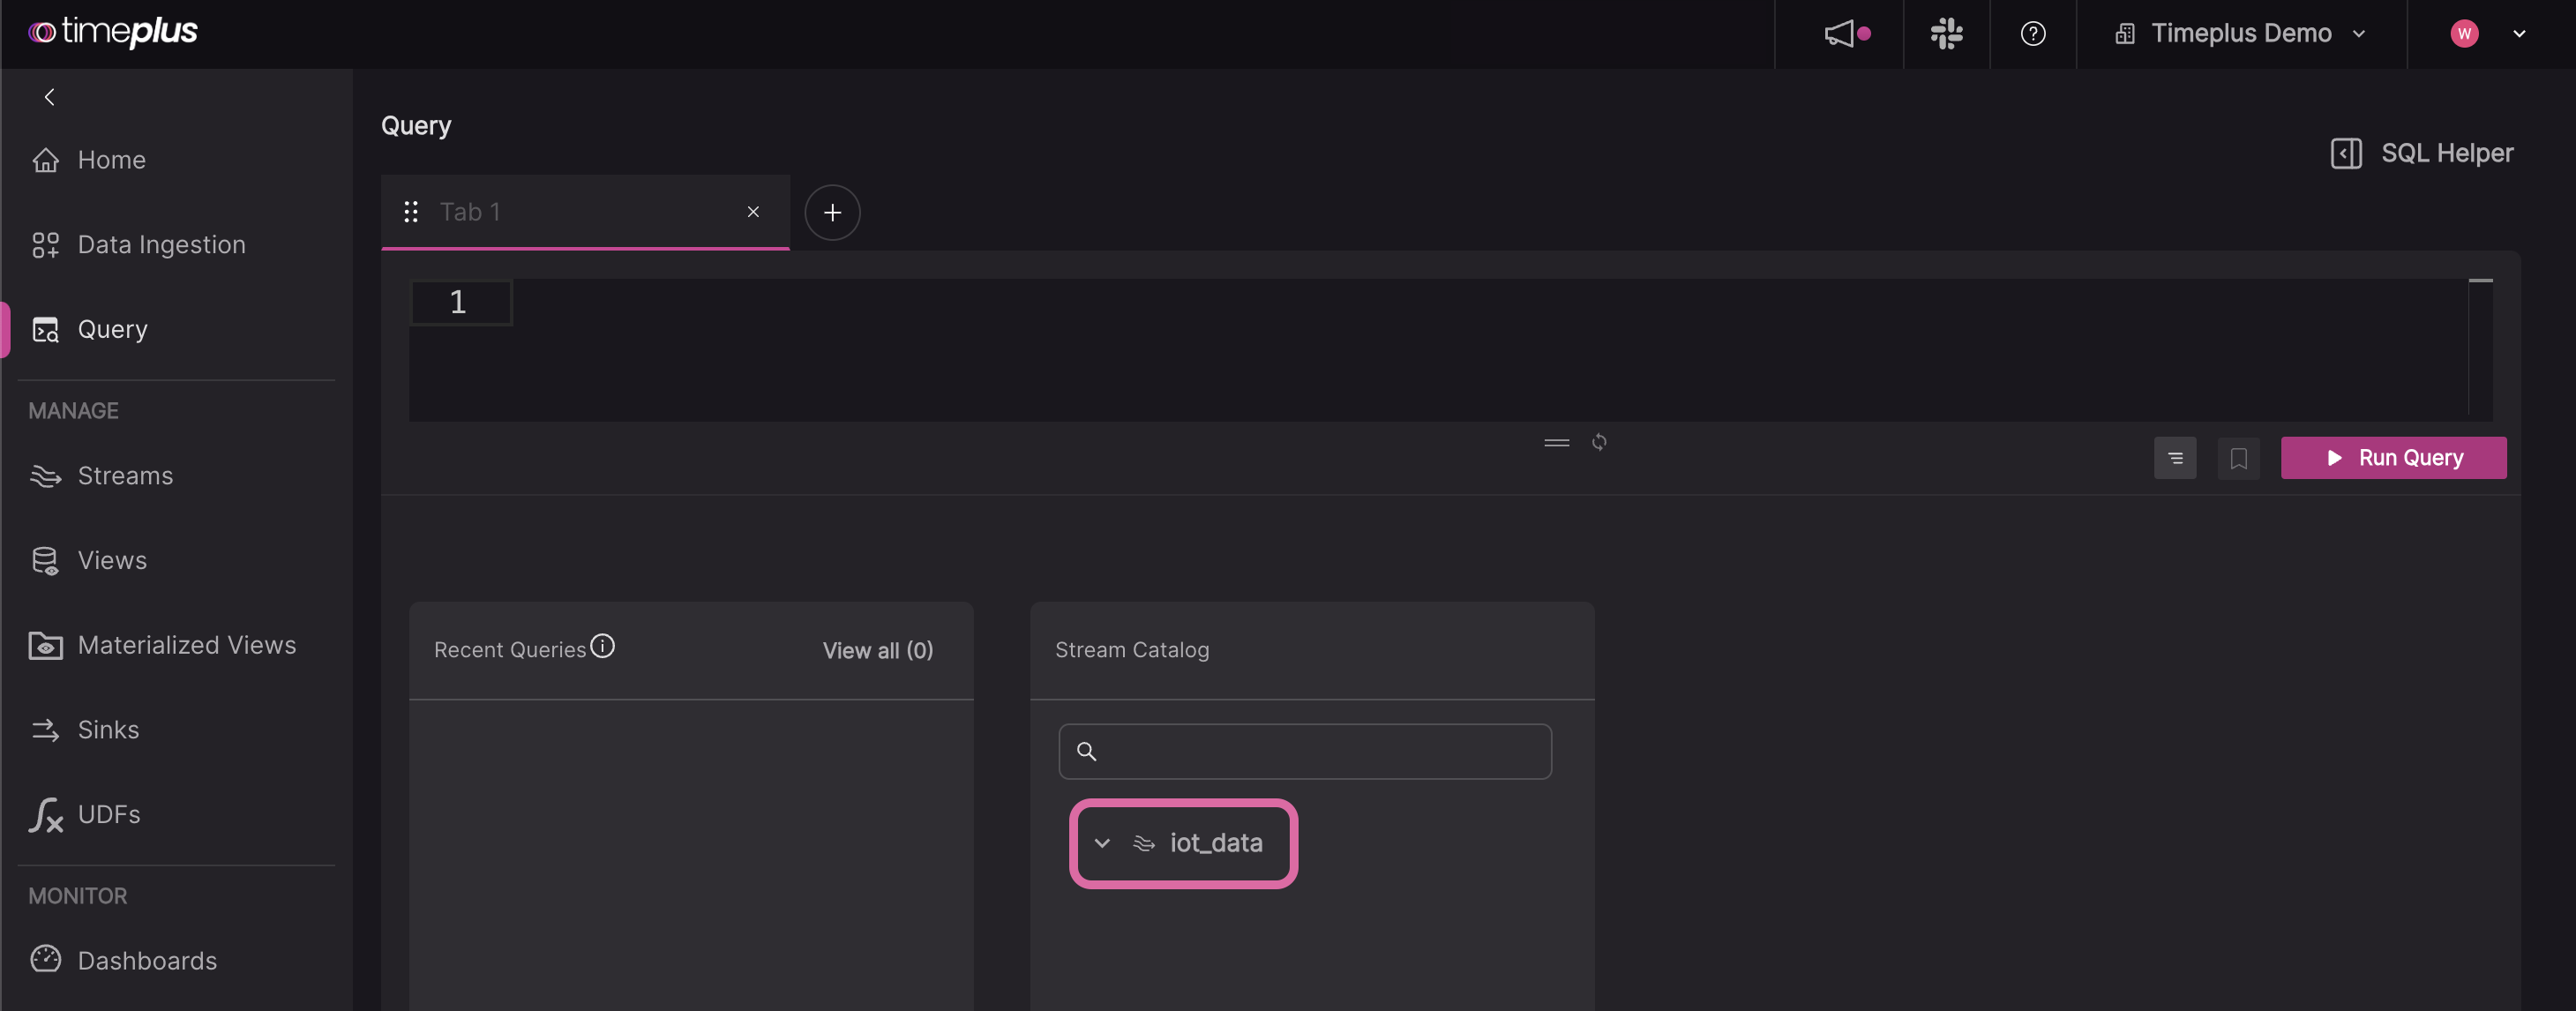
-
Timeplus 会为你生成一个基本查询,例如
SELECT * FROM iot,或者你可以在 编辑器中键入自己的查询。 单击 运行查询 按钮(或在 PC 上按Ctrl+Enter,在 Mac 上按Cmd + Enter)运行查询。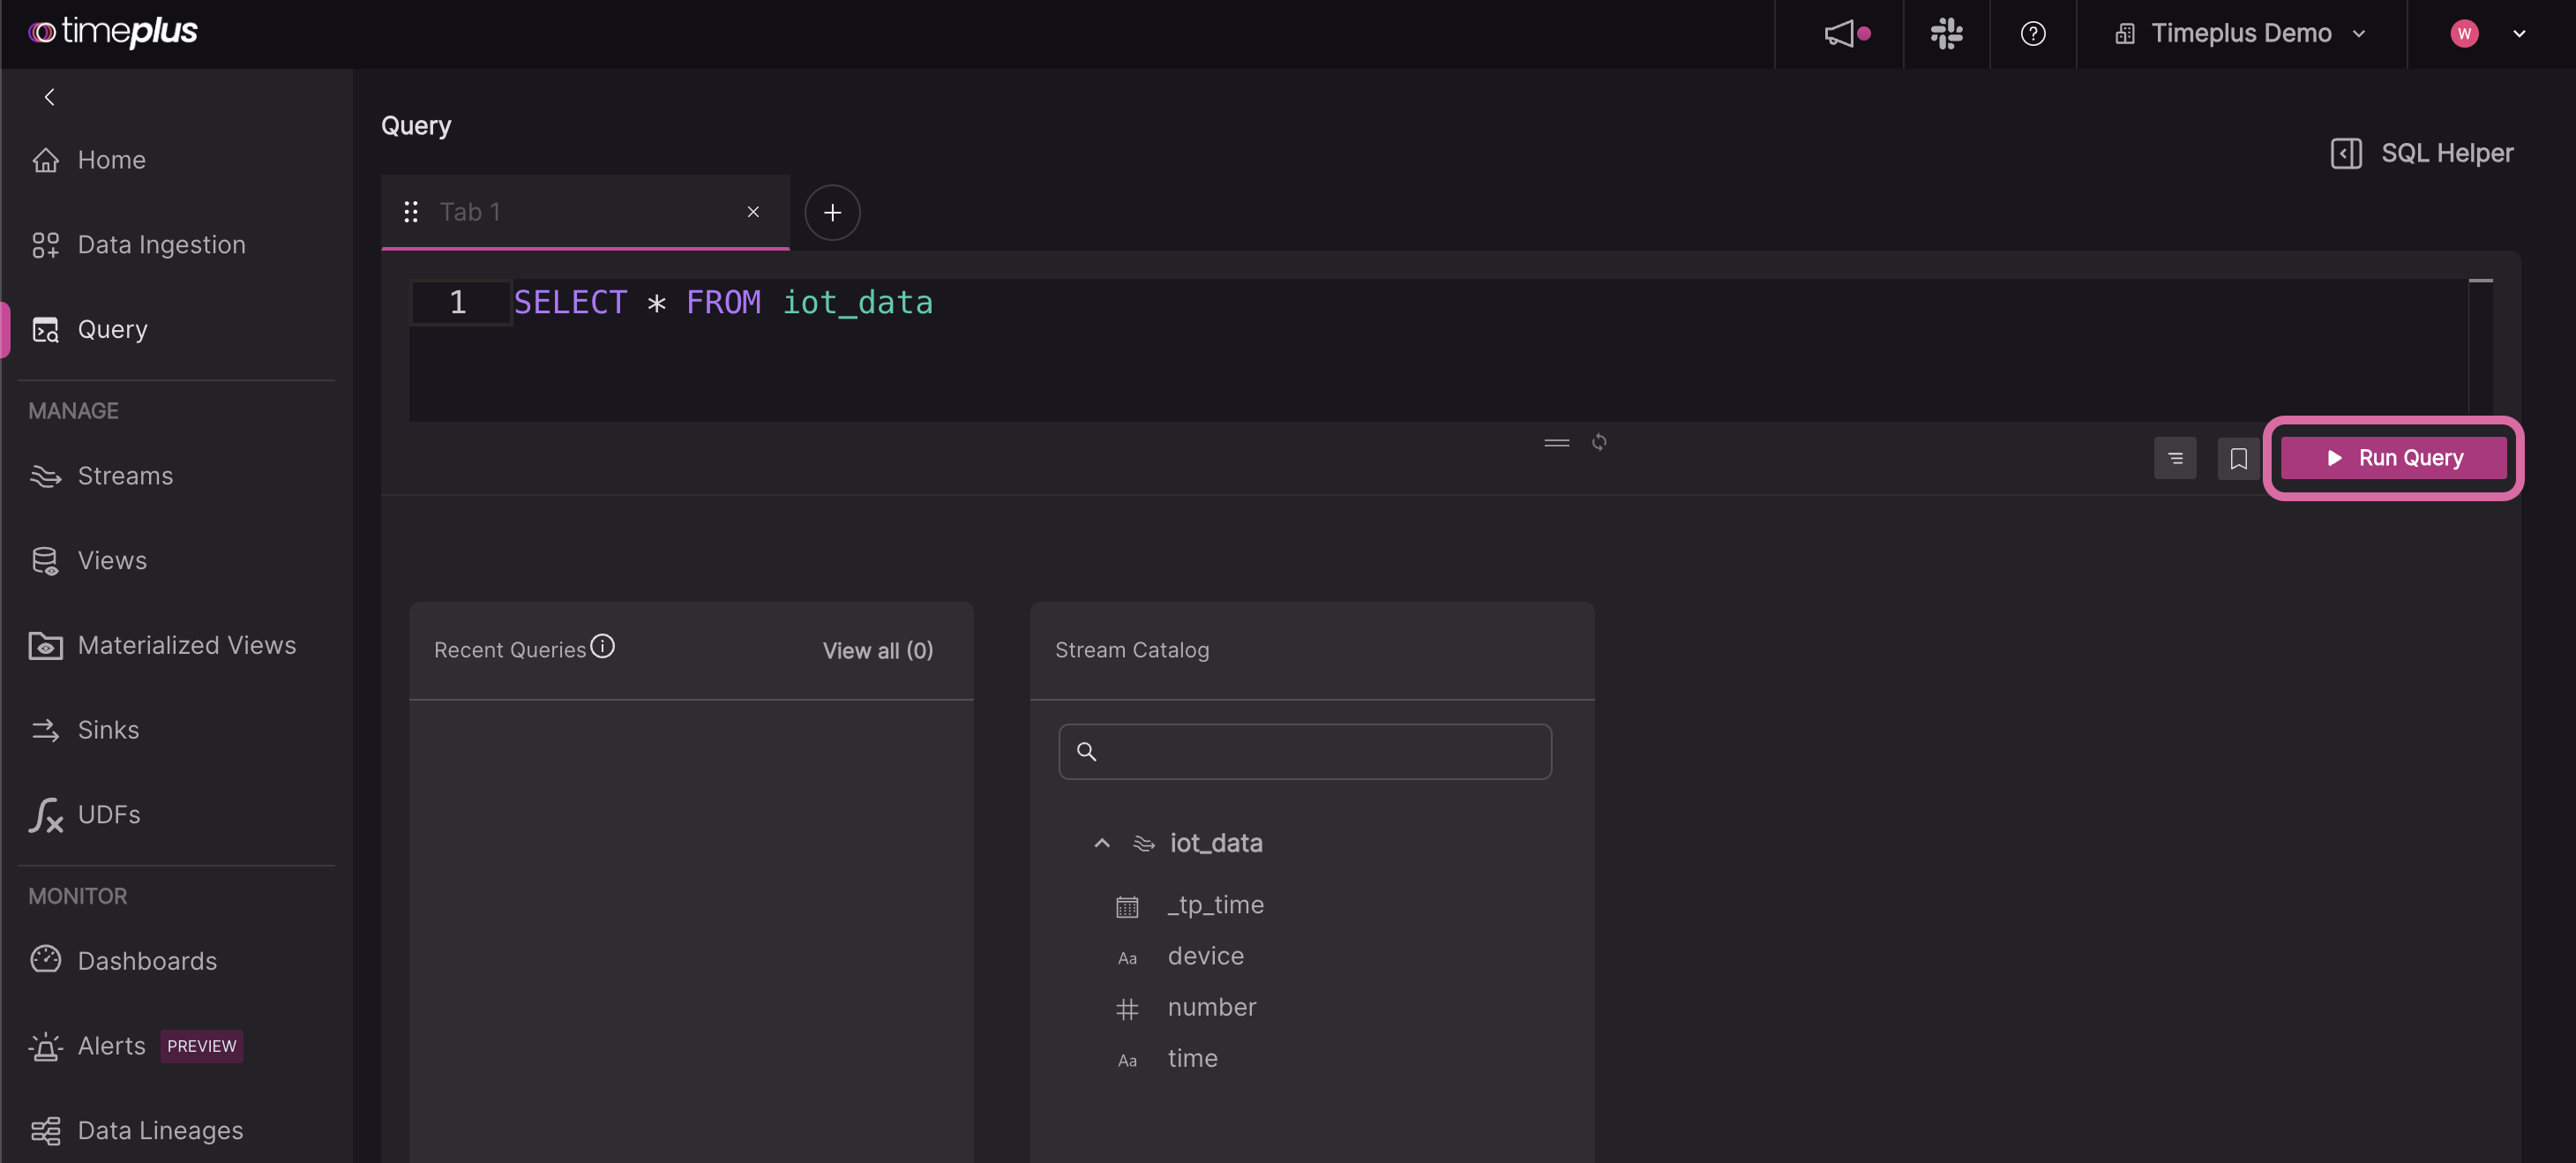
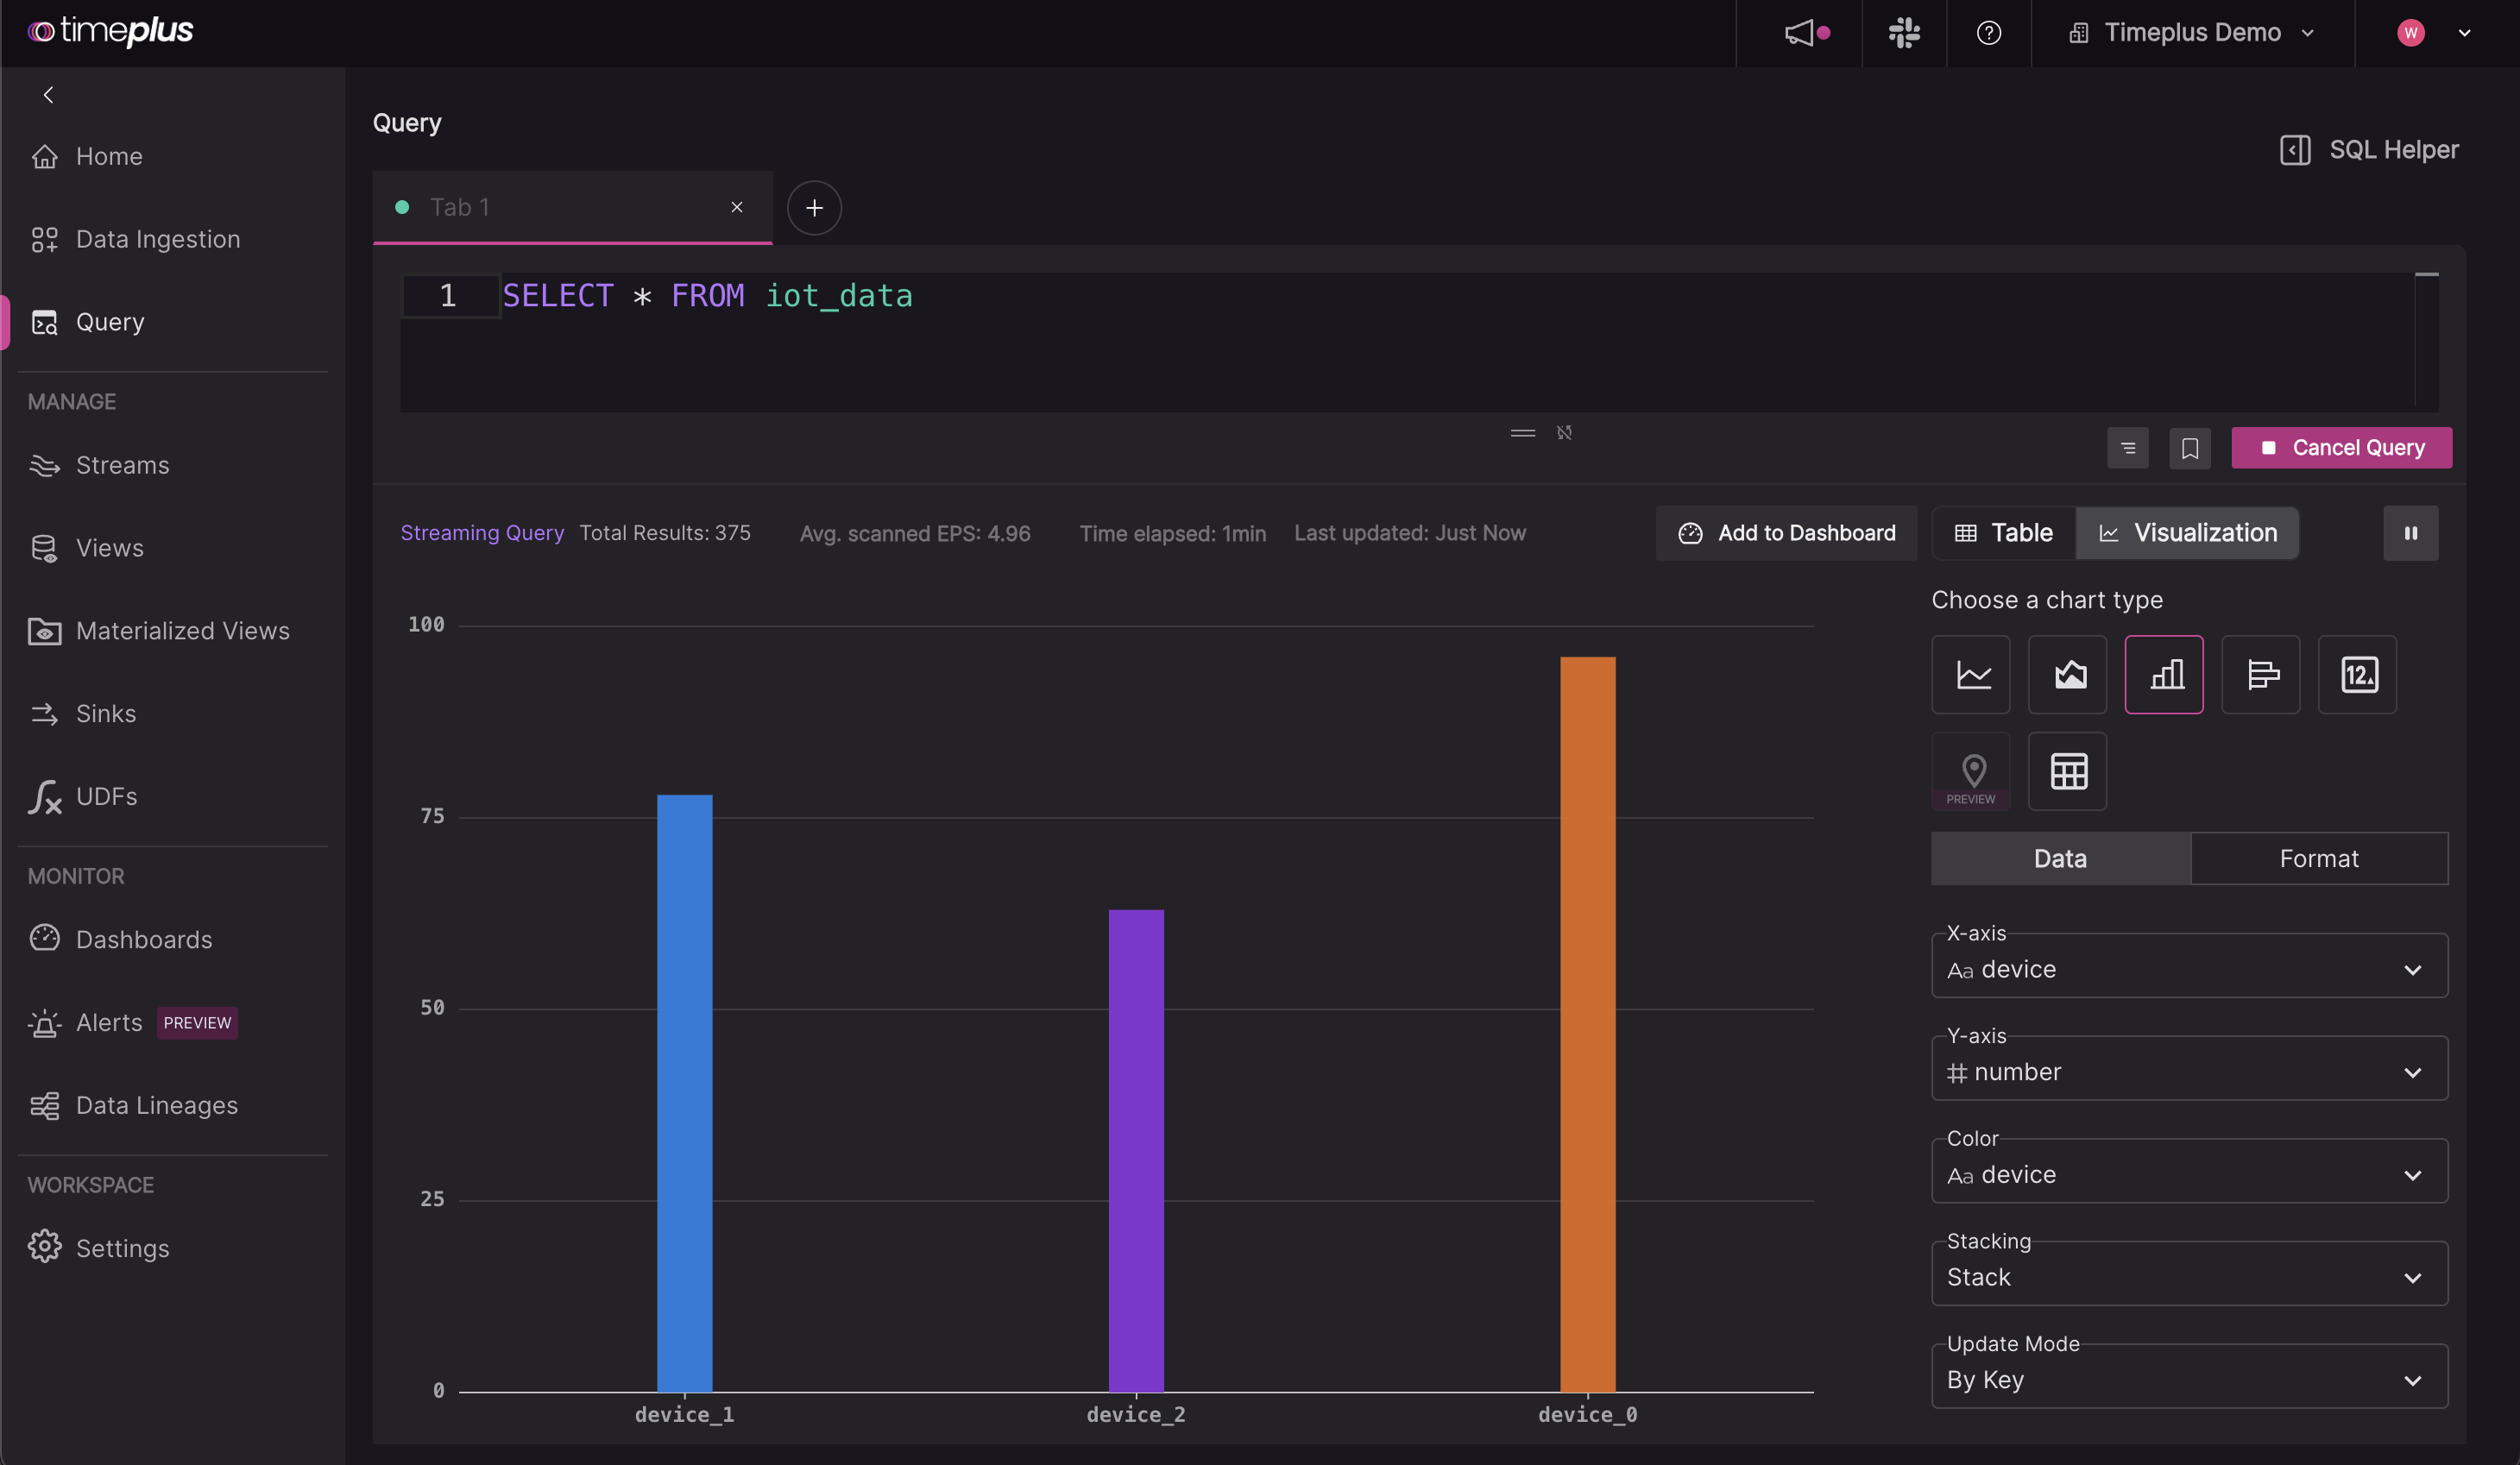
流结果表现在将显示在编辑器下方。 要创建图表,请单击 可视化 选项卡。 [了解有关仪表板和图表的更多信息]
Quickstart for Timeplus Cloud
The following section contains step-by-step instructions on how to easily get started with Timeplus Enterprise in the cloud.
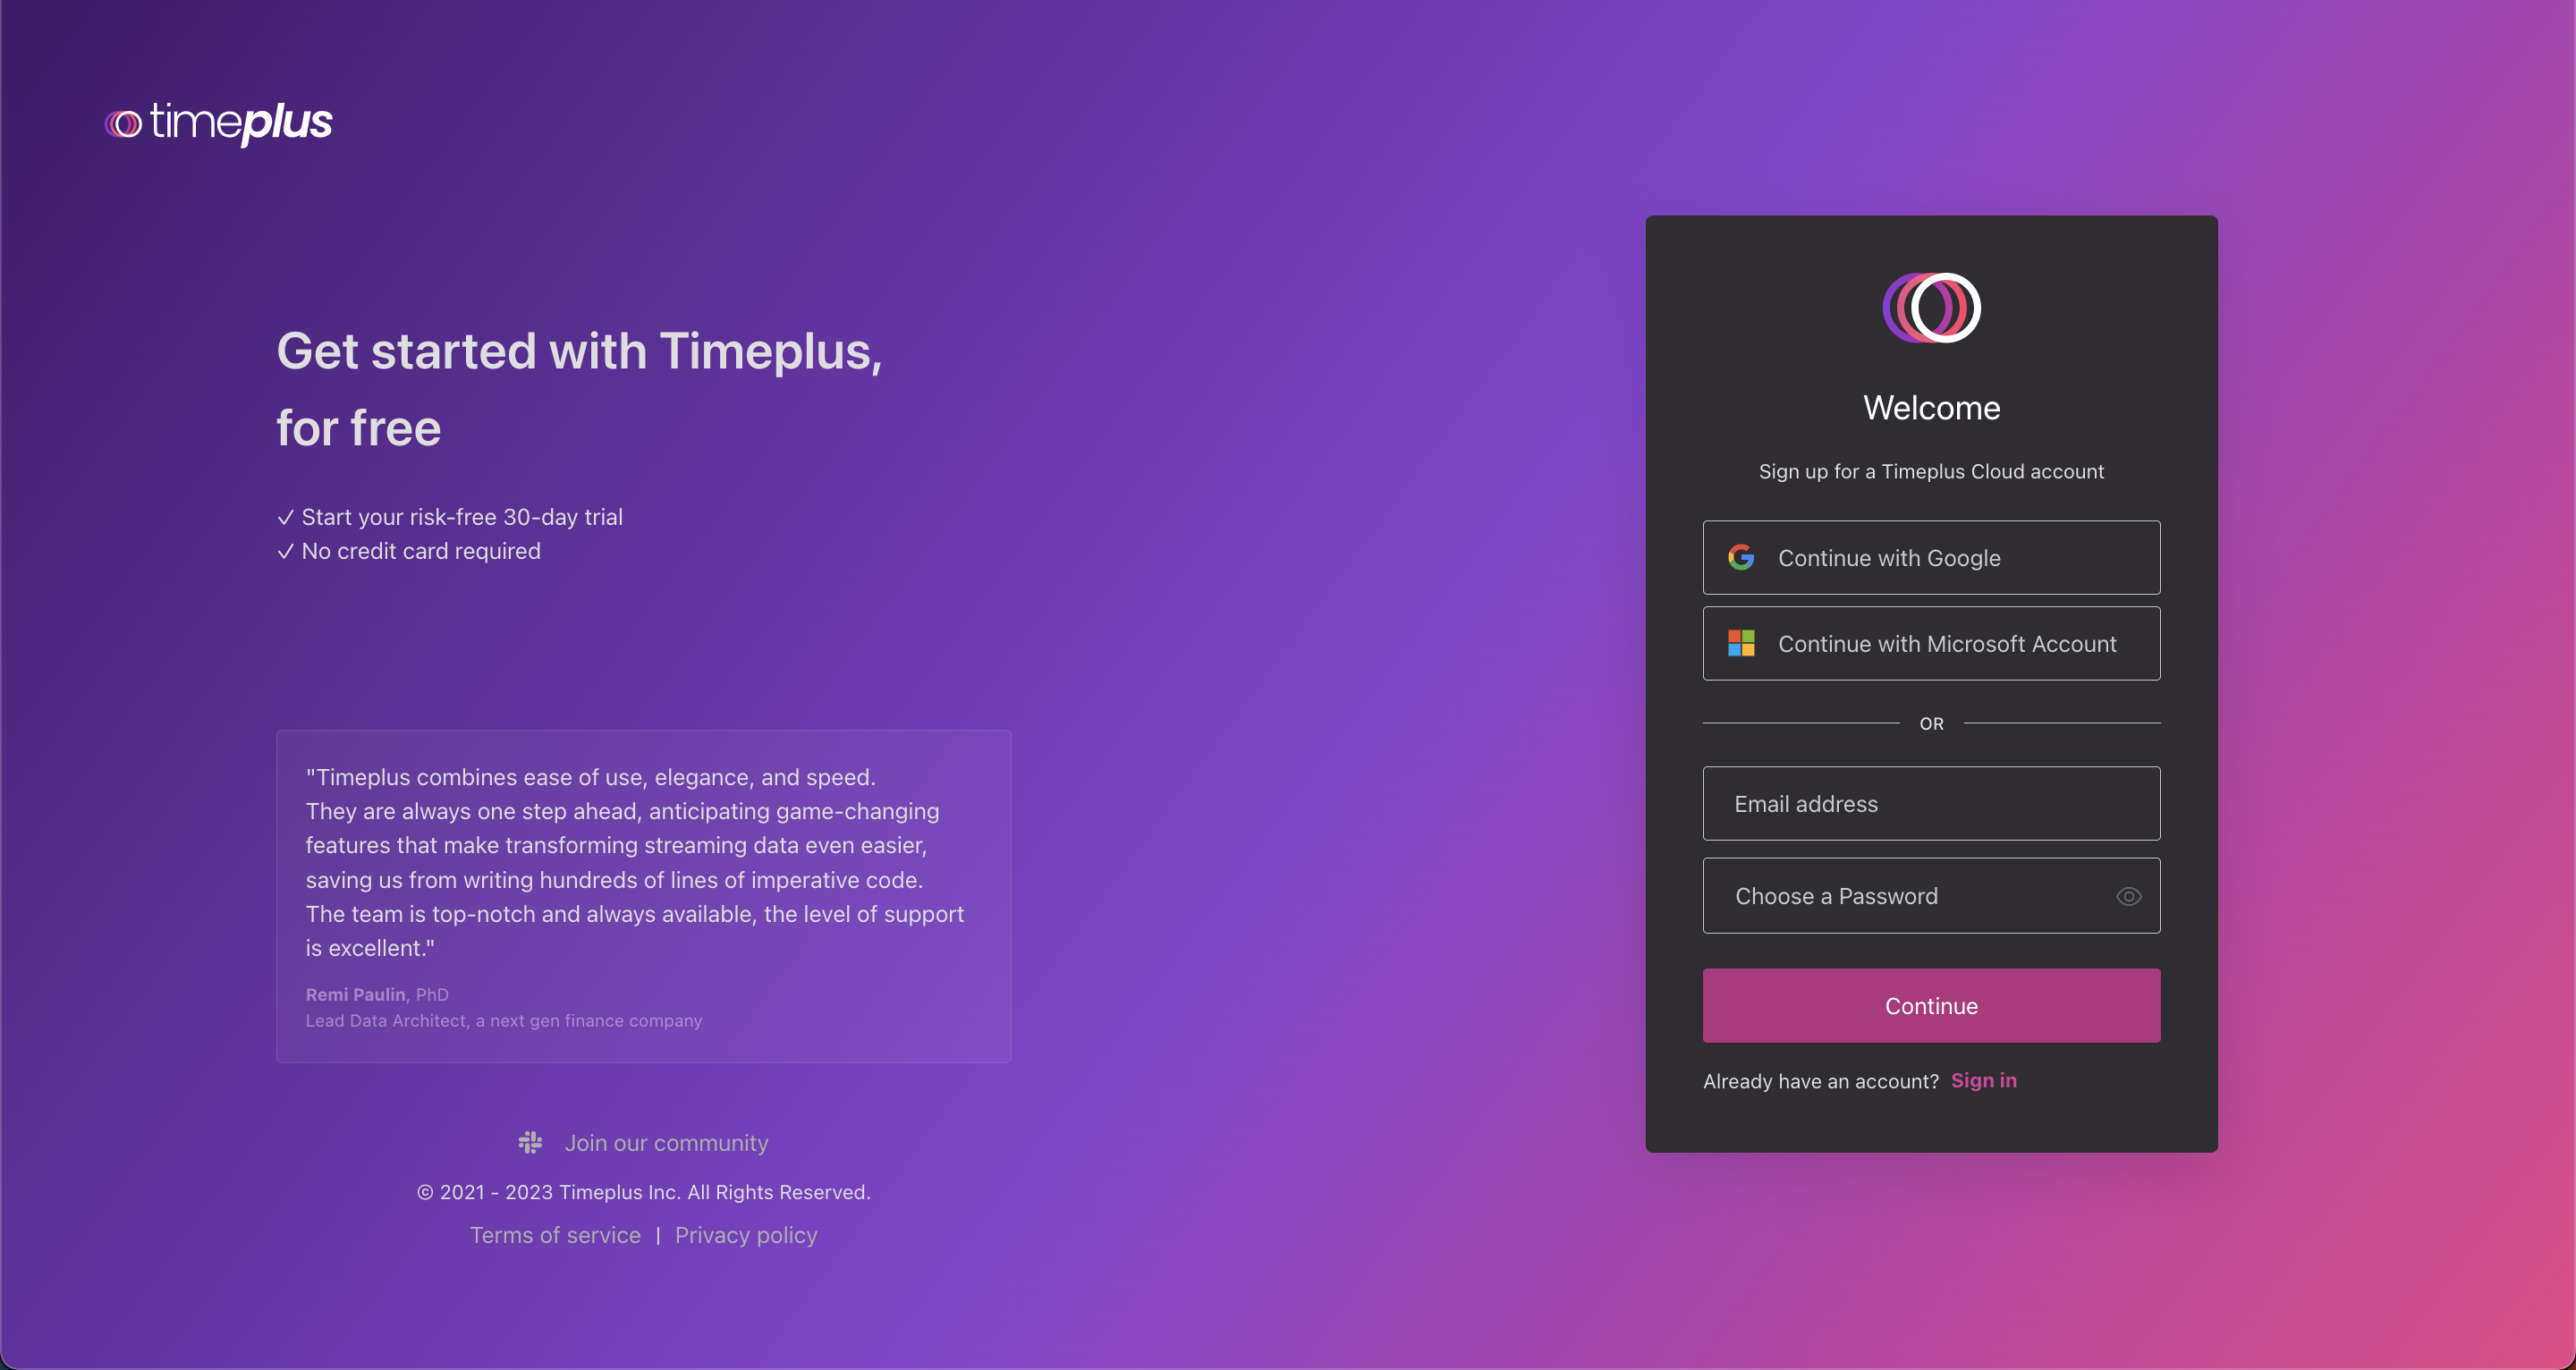
步骤 1:注册一个Timeplus账户
Let's start by creating an account for Timeplus Cloud. 请选择工作电子邮件或 Google/Microsoft 帐户进行注册。 请选择工作电子邮件或 Google/Microsoft 帐户进行注册。 It usually takes less than 2 minutes to get the account set up and have the first workspace created.
第 2 步:设置您的账户和工作空间
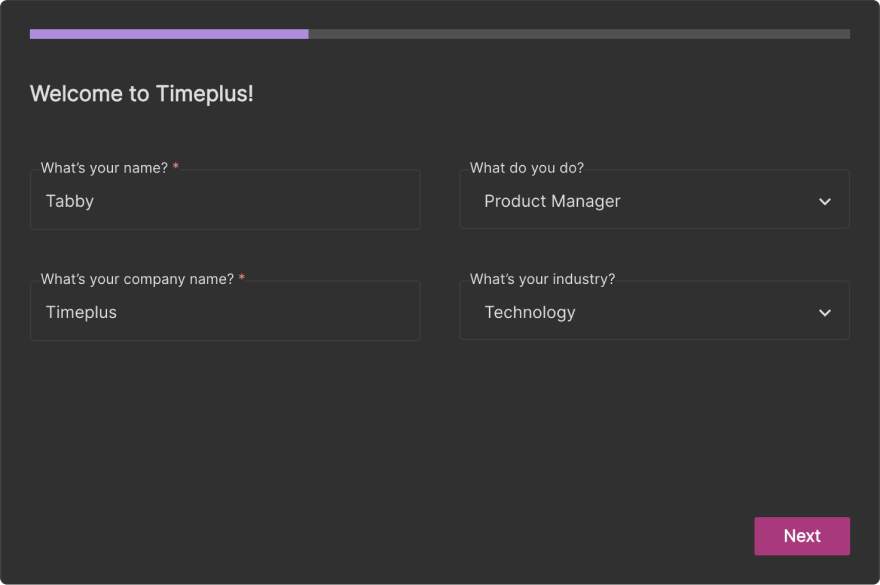
通过快速完成账户设置,向我们介绍一下你自己:
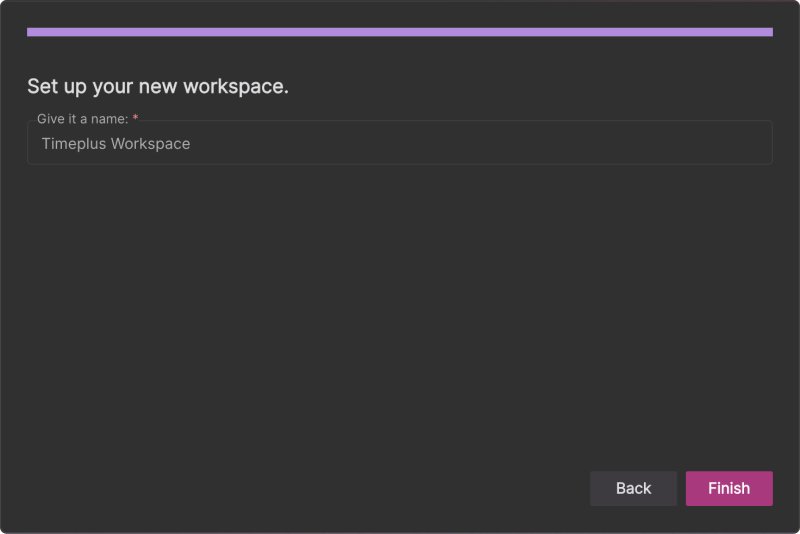
设置的最后一步是命名您的新工作空间,这是一个独立的存储和计算单元,供您运行流式数据收集和分析。 给它起个名字:
Step 3: Load data and run stream processing
Please refer to Step 3 of the previous section.
下一步是什么?
- Ingest additional data streams
- 写下 流查询
- Create additional charts from streaming data with visualizations and dashboards
- Send the results of your queries to a sink