Integration with Grafana
Grafana has long been one of the most popular tools for real-time monitoring and data visualization, helping organizations track metrics and analyze trends through a single, user-friendly interface. For Timeplus Enterprise or Timeplus Proton, you can try the Grafana plugin for Timeplus with the source code at GitHub. This plugin was designed to leverage Grafana’s new Grafana Live capability, allowing users to keep their SQL query results up-to-date without the need to refresh their dashboards. Check out here for sample setup.
User Feedback
"Using Timeplus and Grafana together has been awesome to work with! Timeplus simplifies what was a delicate manual transform process into an automatic SQL-based process. Grafana+Timeplus turns repetitive full queries into streaming incremental updates which makes the Grafana dashboard experience much more immersive, without all the constant full dashboard updates." - Jason Patterson, Director of Network Architecture, RocNet Supply
Key Use Cases for Timeplus Grafana Plugin
Our Timeplus Grafana Plugin provides a flexible, powerful way to enhance your dashboards with real-time insights. Here are a few ways our users are already benefiting:
- Real-Time Operational Monitoring: Track key metrics with high-frequency data, such as system load, application performance, or network traffic, to identify and resolve issues as they arise.
- Customer Experience Insights: Monitor live customer interactions, such as usage patterns, in-app behavior, or user activity across different regions, to improve responsiveness and overall service quality.
- Advanced Analytics on Streaming Data: Combine metrics from Grafana with Timeplus streaming SQL capabilities to perform complex analytics—filtering, aggregating, and transforming data in real time for deeper insights into business operations.

How to Get Started with Timeplus Grafana Plugin
Getting started with the latest version of the Timeplus Grafana Plugin is straightforward.
Step 1: Install the Timeplus Plugin
First, download Timeplus Grafana Plugin from our Github release page.Next install the Timeplus plugin in your Grafana deployment. For detailed guide, please refer to Grafana docs.
unzip timeplus-proton-datasource.zip -d YOUR_PLUGIN_DIR/my-plugin
After installing the plugin, restart Grafana to enable it.
Step 2: Configure the Plugin in Grafana
- Login to Grafana’s web UI and navigate to Connections -> Data Sources.
- Locate the Timeplus Data Source by scrolling or searching for “Timeplus.”
- Configure the Connection Parameters:
- For Timeplus Enterprise, create an admin account when you start Timeplus for the first time and use those credentials here.
- For Timeplus Proton, use the default username with no password.
- Save and Test the Connection by clicking the Save & Test button to confirm the plugin is connected successfully.
Step 3: Create a Dashboard and Visualize Data
- Follow the “Build a Dashboard” link to start a new dashboard, and add a visualization.
- Select the Timeplus data source you configured earlier.
Now, you can enter SQL queries to retrieve and visualize data from Timeplus directly in Grafana.
Step 4: Example - Monitoring Real-Time Bitcoin Price
To showcase the power of real-time streaming with Grafana and Timeplus, let’s set up a feed for live Bitcoin pricing:
- In Timeplus Enterprise, open the Data Collection Wizard and choose Coinbase Exchange as the data source. If you haven’t tried Timeplus, please download the package at https://www.timeplus.com/product .
- Use the default settings to load
BTC-USDdata feed. - After the source is created. Click on the first button to run an ad-hoc query to review the data from the newly created data stream.
SELECT * FROM coinbaseYou should see the live data with multiple columns. - Return to the Grafana UI and run the following SQL query on the new view:
select _tp_time, price from coinbase
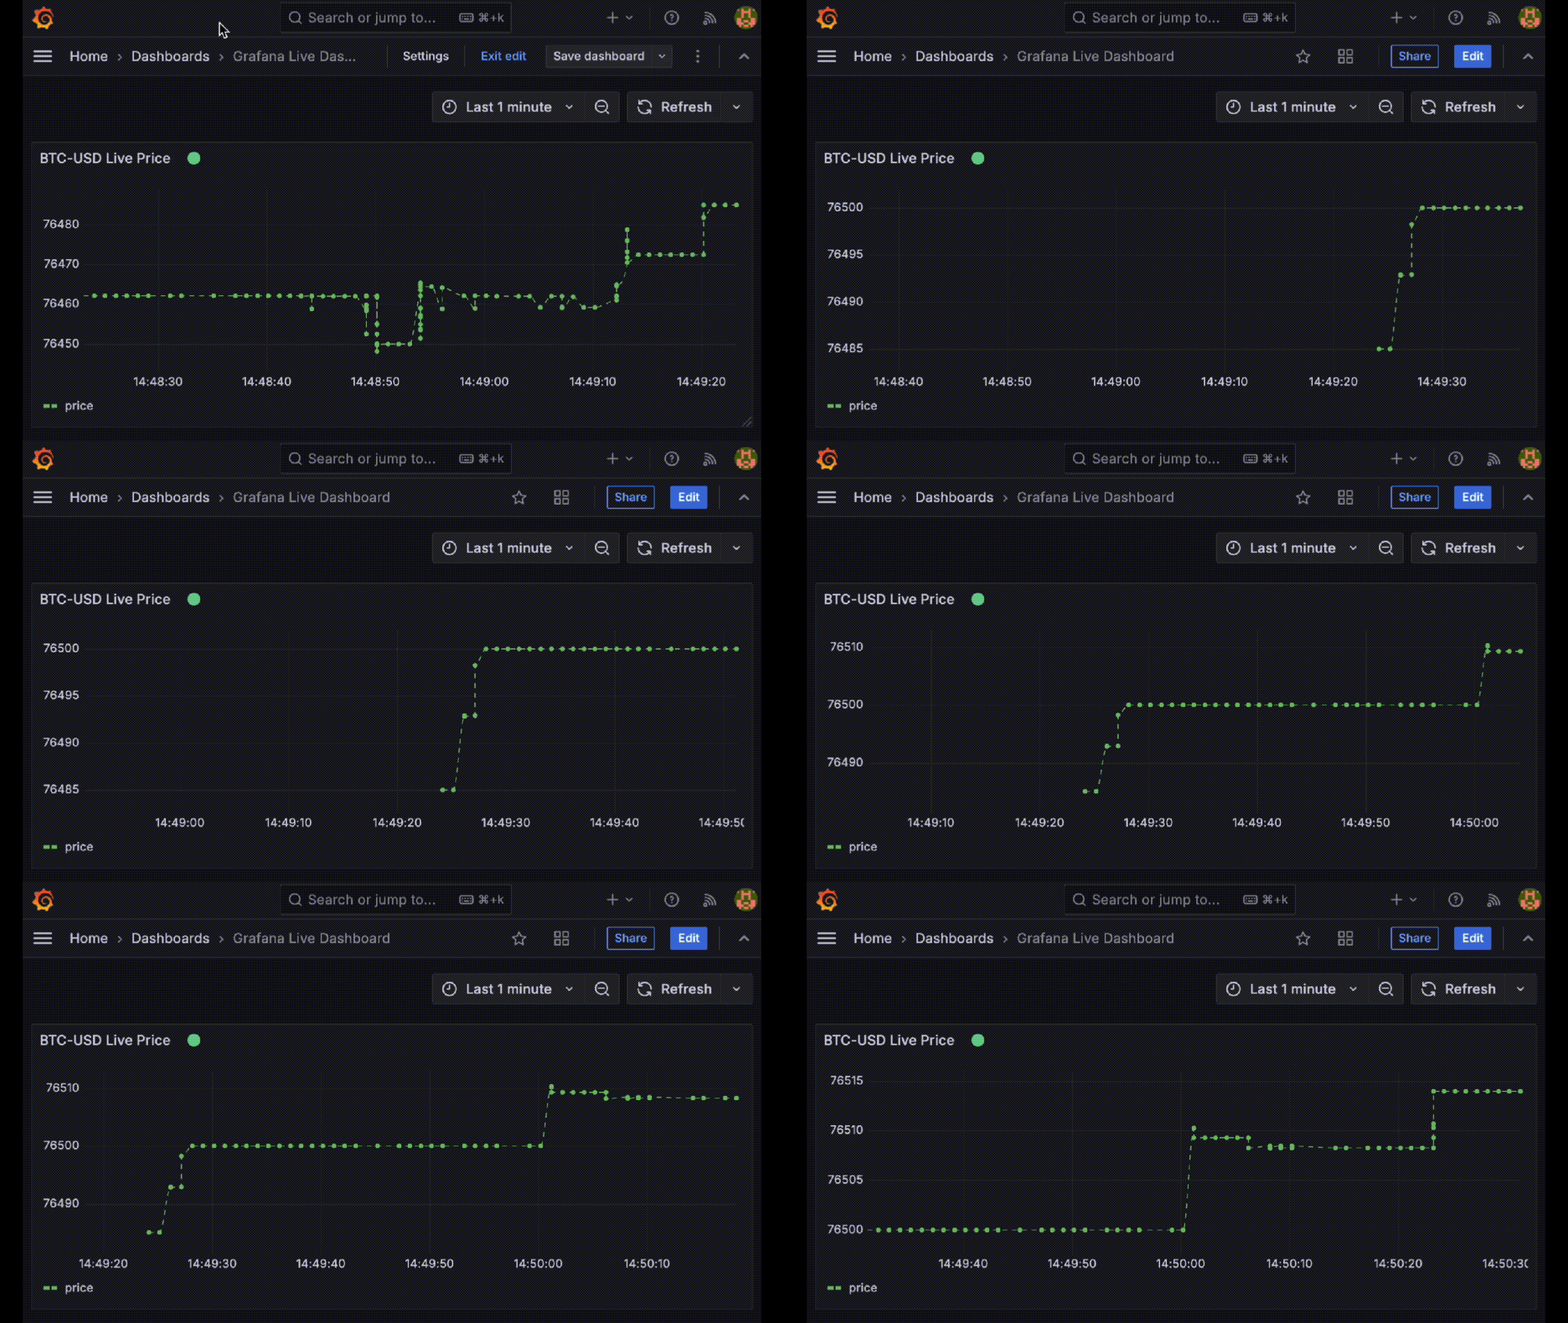
Grafana will now load the live data from Timeplus and display it as a line chart. To get a closer look at recent trends, adjust the time period from the default 6 hours to the last 5 minutes.
With this setup, you can now use Grafana to monitor live prices and transaction data in the cryptocurrency market. Additionally, you can expand this dashboard by adding SQL-based alerts or logic to detect potential trading signals in real time.
Change Log
2.1.5
Released on 01-12-2026
- Respected the query interval setting.
2.1.4
Released on 12-12-2025
- Fixed a concurrent panic issue when running query
- Bumped proton-go-driver to 2.1.2
2.1.3
Released on 05-12-2025
- Fix the render issue for nullable columns
2.1.2
Released on 02-04-2025
- Fix ref id for data frames
2.1.1
Released on 01-22-2025
- Propagate the error message from the backend to the frontend
- Set batch size to 1000 and batch interval to 100ms for the streaming query
2.1.0
Released on 01-12-2025
- Support query variables and annotations
- Updated Grafana Go SDK
2.0.0
Released on 11-05-2024
- Updated Grafana Go SDK and Proton Go driver
- Unlisted from Grafana marketplace