Timeplus Enterprise Quickstart
The following section contains step-by-step instructions on how to easily get started with a self-hosted Timeplus Enterprise.
Step 1: install Timeplus Enterprise via a single command
If your server or computer is running Linux or MacOS, you can run the following command to download the package and start Timeplus Enterprise without any other dependencies. For Windows users or Docker users, please follow our guide for running Timeplus Enterprise with Docker.
curl https://install.timeplus.com | sh
This script will download the latest package (based on your operating system and CPU architecture) to the current folder, uncompress the package and start the Timeplus Enterprise server. You can also download the package manually from here, uncompress it and start the server via timeplus/bin/timeplus start.
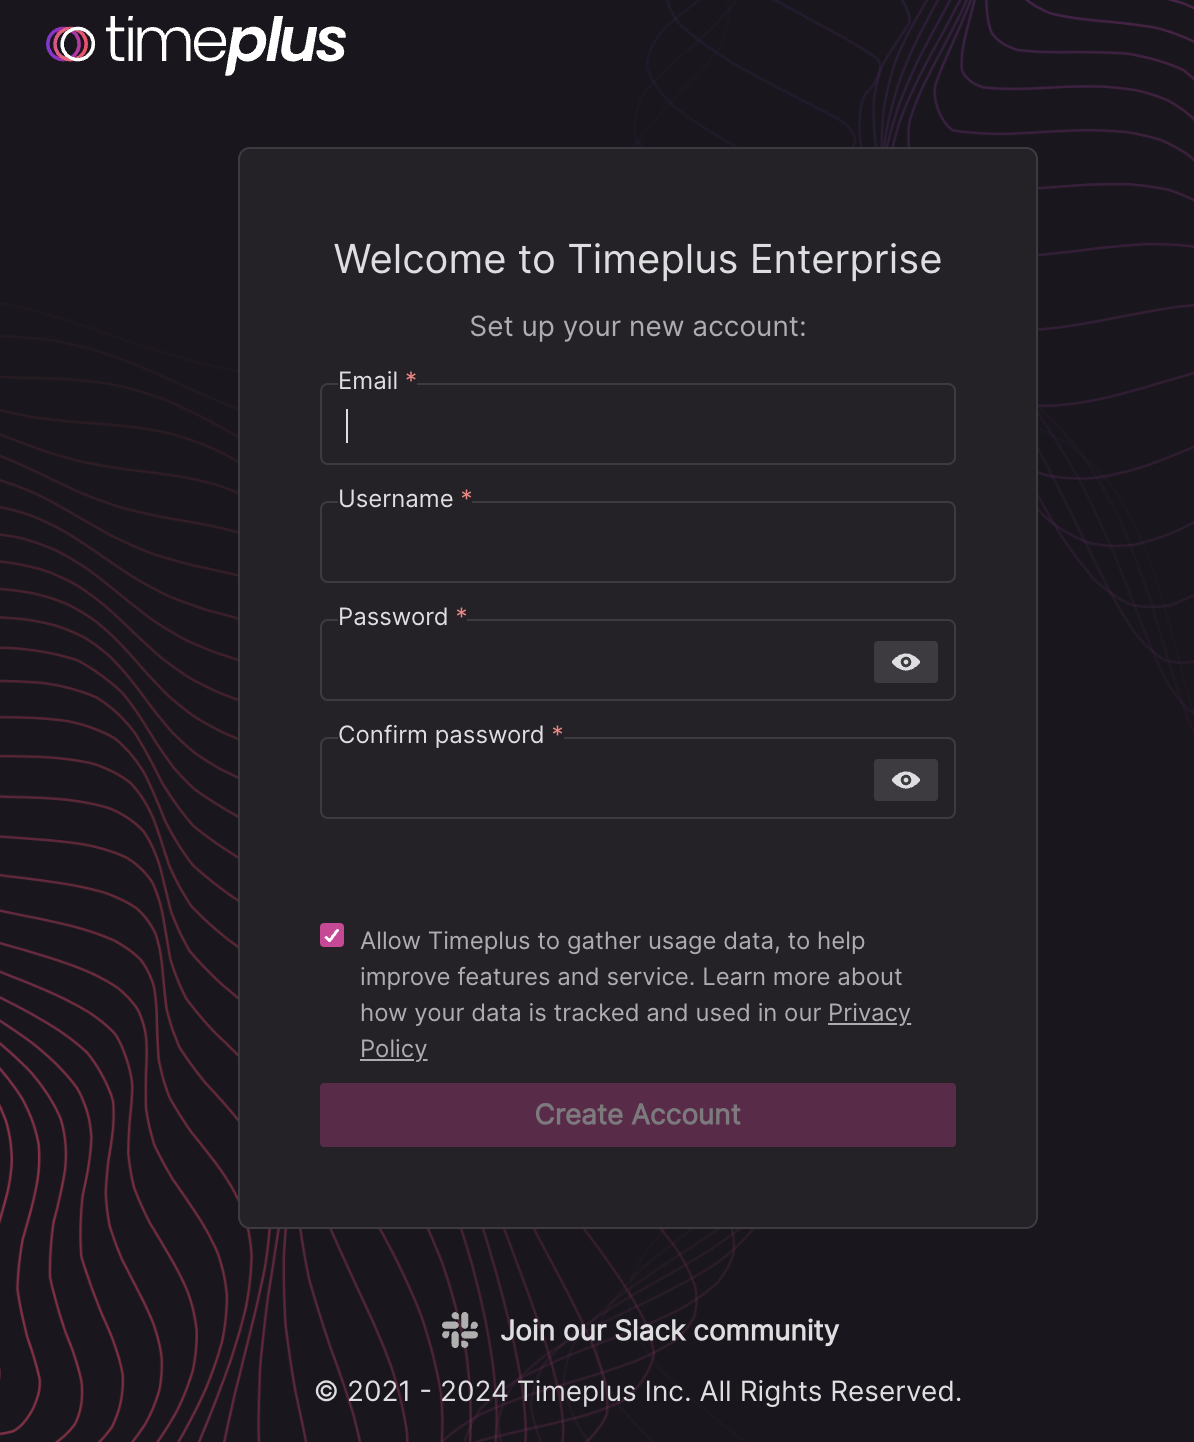
Step 2: Setup the user account
Access the Timeplus Enterprise web console via http://localhost:8000. On your first login, please create an account with a password to start the 30-day free trial.
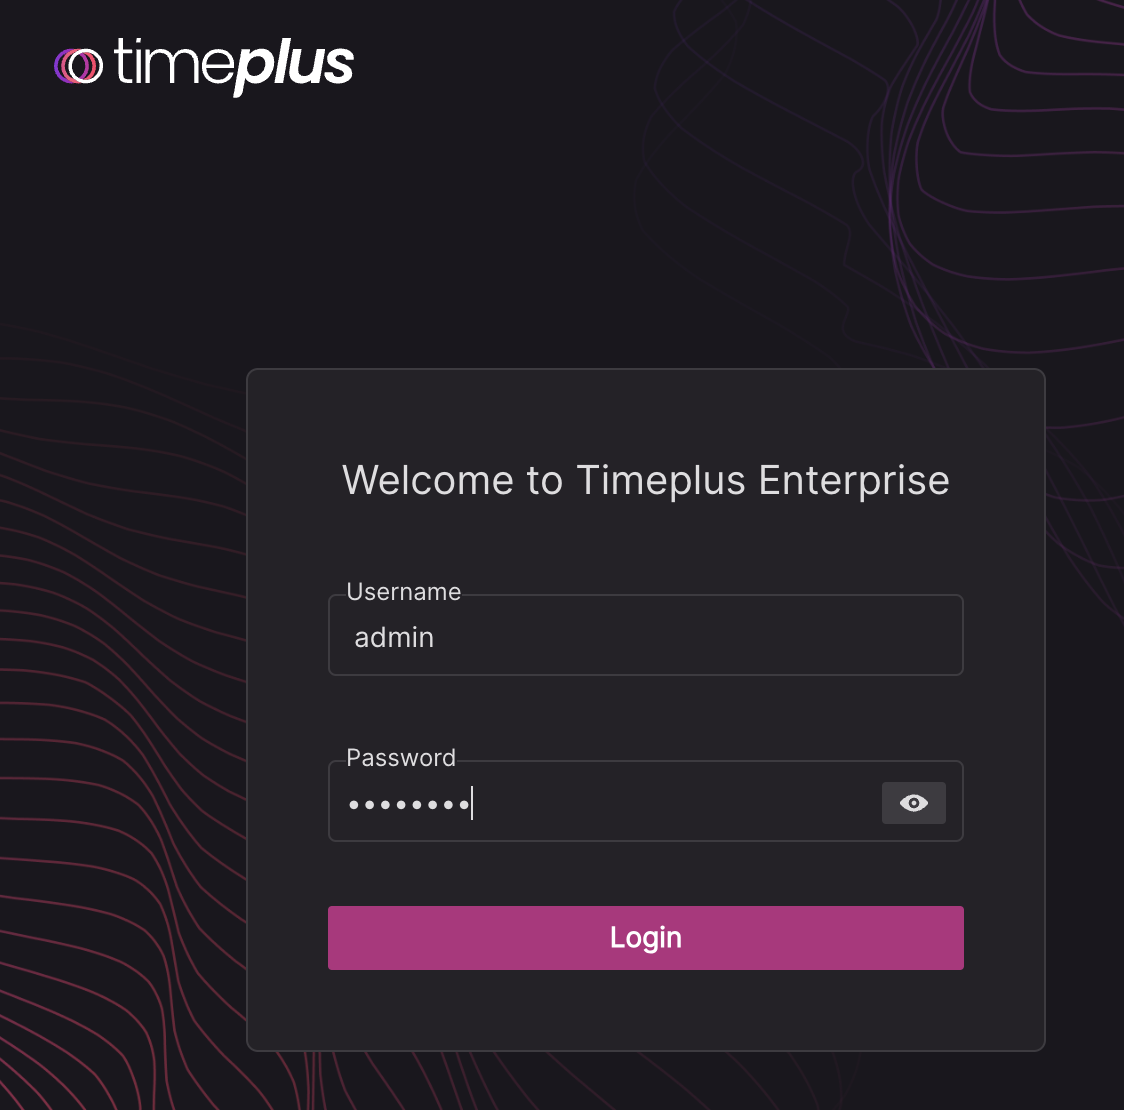
After creating the account, login with that username and password.
Step 3: Load your streaming data
If your streaming data resides in or a publicly accessible Kafka or Pulsar instance, follow one of following docs to setup data access in Timeplus, then return here to complete the quickstart:
- Apache Kafka
- Confluent Cloud
- Apache Pulsar
- REST API, SDK, and others
If you don't yet have a streaming data source and would like test out how Timeplus works, Timeplus provides a built-in data source to generate streaming data for some common use cases.
Load sample data
- In Timeplus Enterprise, open the Data Collection Wizard and choose Demo Stream.
- Choose one of the three sample datasets and click Next button to create a random stream with specified name.
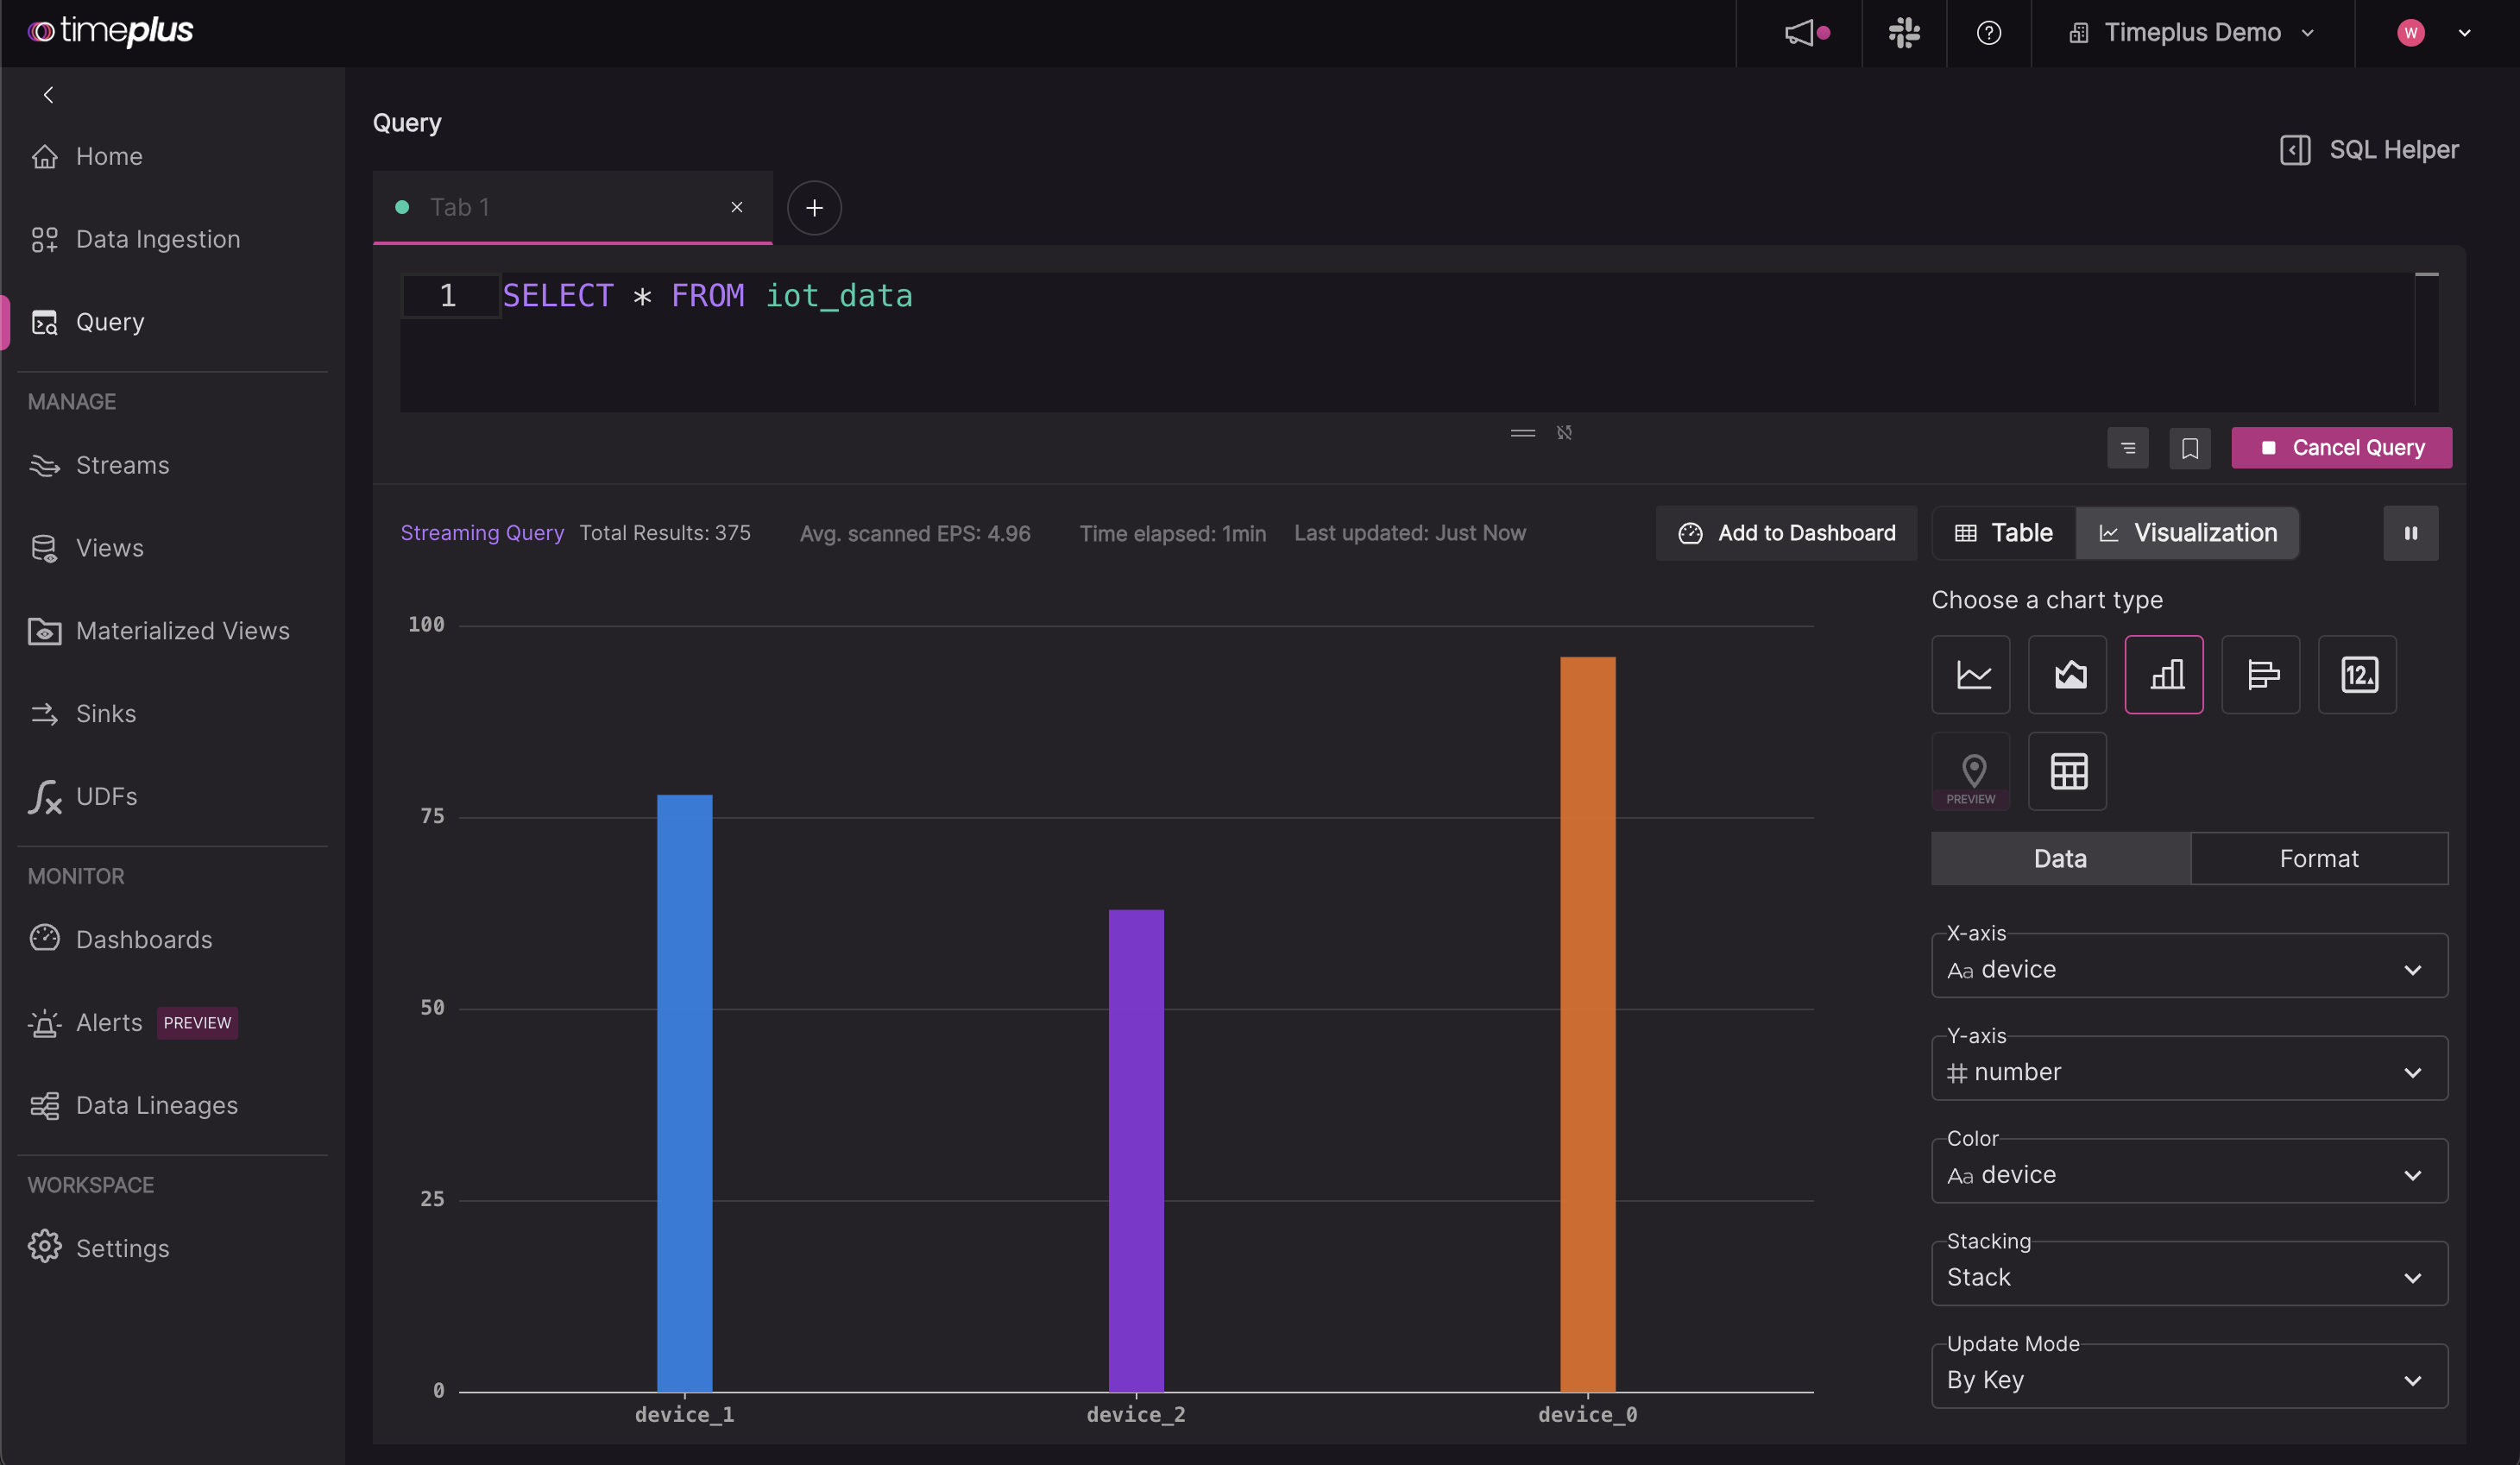
- After the stream is created. Click on the first button to run an ad-hoc query to review the data from the newly created data stream.
SELECT * FROM ..You should see the live data with multiple columns.
Explore streaming data
The streaming results table will now appear below the editor. To create charts, click on the Visualization tab. Learn more about Dashboards and Charts
Step 4: Send data out
To send data to Kafka, ClickHouse or other systems, you can submit a streaming SQL in SQL Console, and click the "Save As" button and choose "Sink".
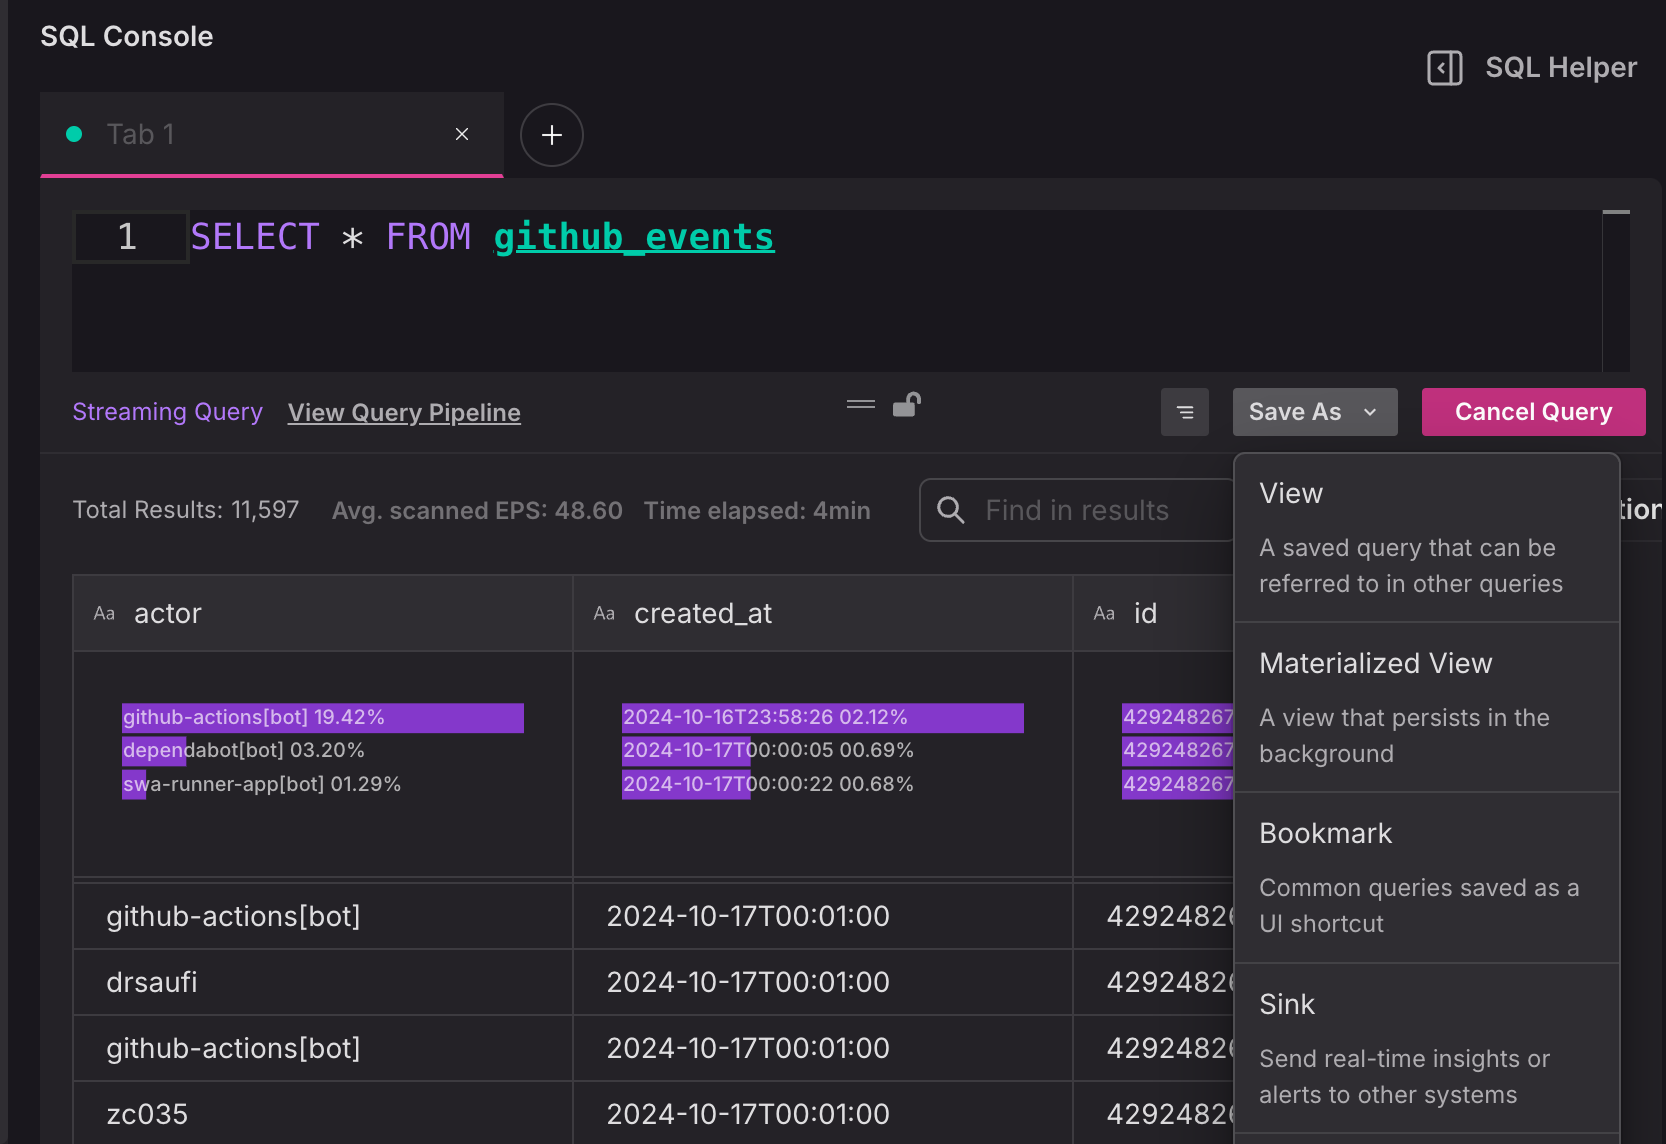
Timeplus supports various systems as the downstreams: